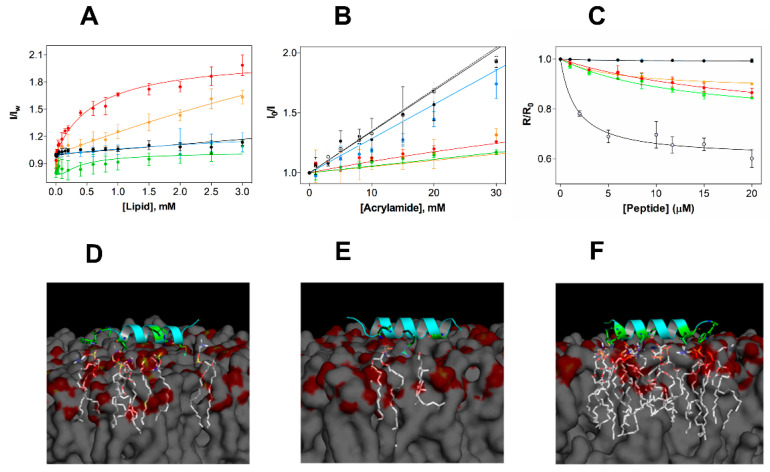
Figure 3.
Experimental and in silico studies of the membrane selectivity of EcDBS1R4. (A) Partition curves of 6 µM EcDBS1R4 to LUVs of different compositions. Solid lines represent fits obtained using Equations (2) and (3). The LUV compositions used were POPC (black), POPC:Chol 70:30 (blue), POPC:POPG 70:30 (red), IML (POPE:POPG:CL 63:33:4) (green) and OML (POPE:POPG:CL:LPS 80:16:1:3) (orange). (B) Fluorescence quenching by acrylamide of 6 µM EcDBS1R4 in the absence (open circles) and presence of LUVs (color code as in A). Solid lines represent fits obtained using Equations (4) and (5). (C) Changes in membrane dipole potential as a function of EcDBS1R4 concentration, measured with di-8-ANEPPS (4-(2- [6-(dioctylamino)-2-naphthalenyl]ethenyl)-1-(3-sulfopropyl)pyridinium inner salt) in LUVs (200 µM lipid concentration; color code as in A) and E. coli cells (1 × 10⁴ cells/mL), represented by grey filled circles. The plot represents the di-8-ANEPPS excitation ratio R (I455nm/I525nm) for each peptide concentration, normalized divideing by R0 (the R value in the absence of peptide). Solid lines represent fits obtained using Equation (6). The parameters obtained from the fittings are summarized in Table 2. All experiments were conducted in triplicate. (D–F) Three-dimensional theoretical representation of the peptide interacting with membranes composed of POPC (D), POPC:Chol (70:30) (E) and POPC:POPG (70:30) (F), indicating the amino acid residues (in green) and the phospholipid molecules (in white) possibly involved in the interactions (residues involved and distances of interactions occurring for each membrane are detailed in Supporting Information Table 1).

