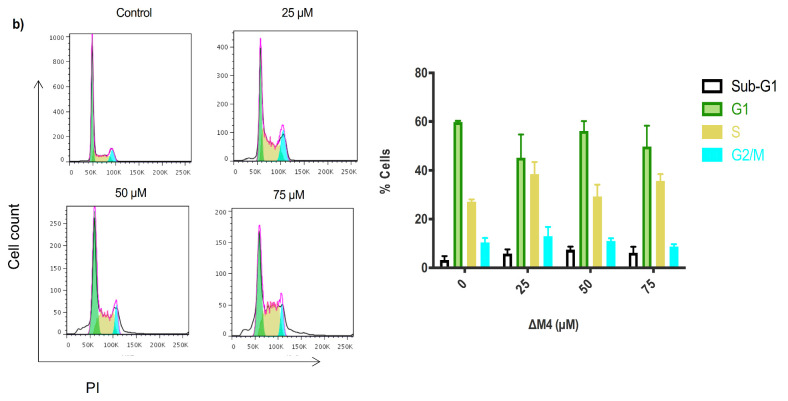
Figure 5.
Cell cycle distribution after ∆M4 exposure in melanoma skin cancer and non-tumoral cells. Cells were treated with different concentrations of ∆M4 for 24 h. (a) A375, melanoma cancer cells; (b) HaCaT, normal human keratinocyte cell line. The following are shown for each cell line: A representative histogram of flow cytometry analysis of the cell cycle distribution; bar graphs for quantification of the cell cycle distribution of the total cell population in the different phases of the cell cycle; and two-way ANOVA for sub-G1, G1, S, and G2/M populations, displaying the difference with respect to untreated cells, where ** p ≤ 0.01.


