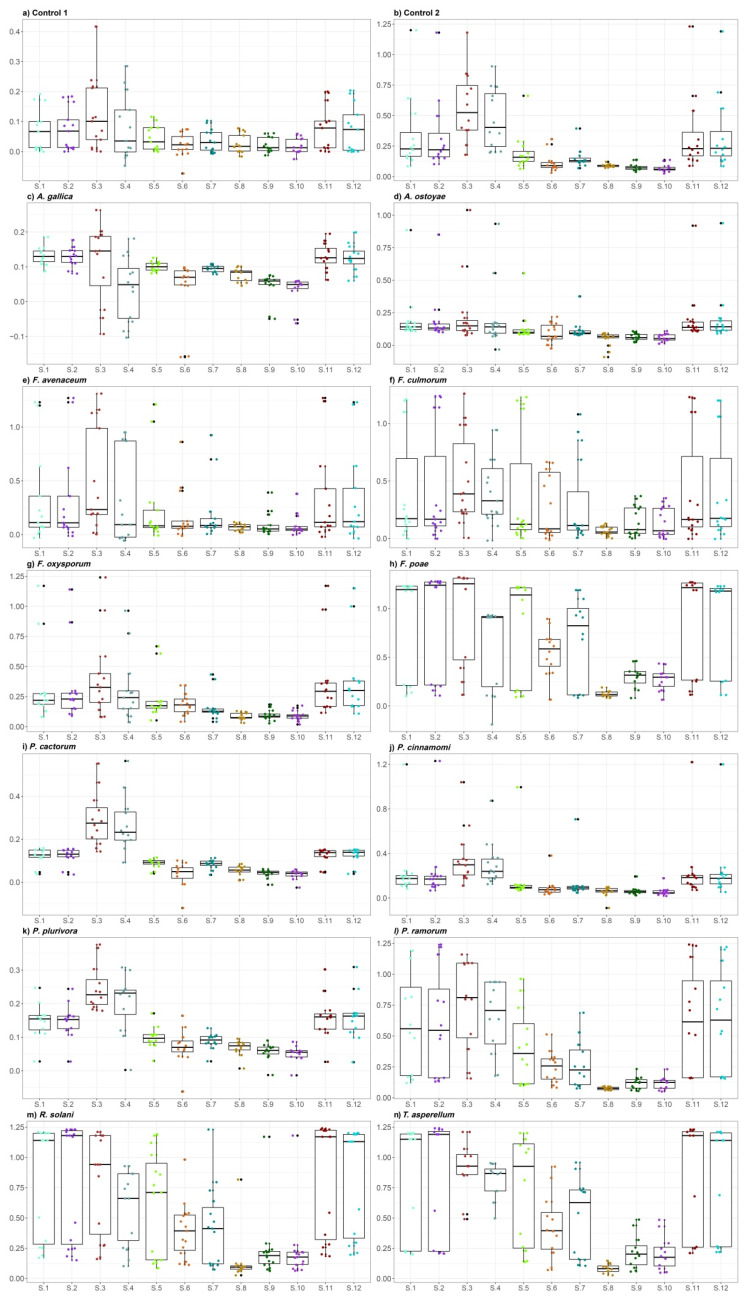
Figure 1.
Distribution of the overall averaged values of twelve differential sensor original signals for the respective 14 treatments; e.g., (a) control 1 (empty flask); (b) control 2 (PDA medium); (c) A. gallica; (d) A. ostoyae; (e) F. avenaceum; (f) F. culmorum; (g) F. oxysporum; (h) F. poae; (i) P. cactorum; (j) P. cinnamomi; (k) P. plurivora; (l) P. ramorum; (m) R. solani; (n) T. asperellum.

