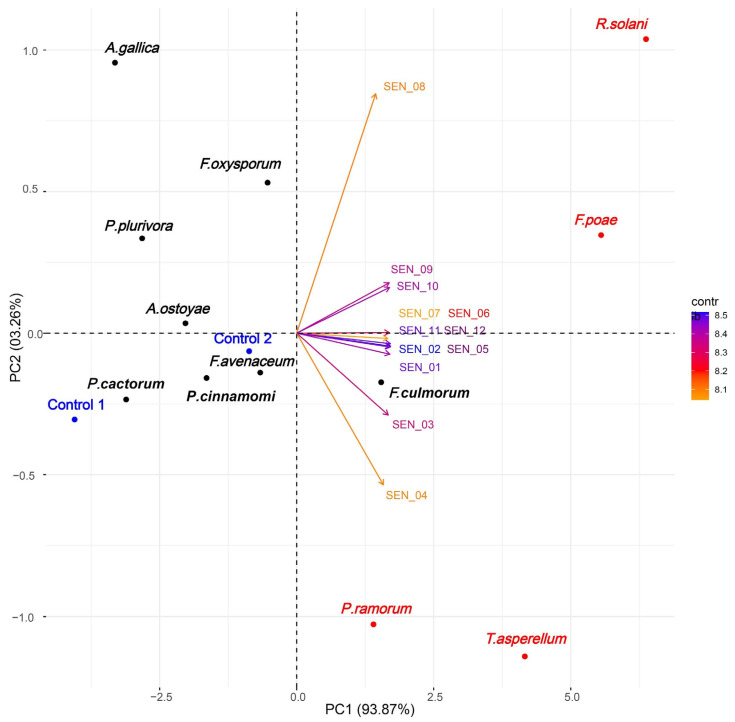
Figure 2.
Variability of twelve differential sensor signals assigned to the twelve investigated microorganisms. Vectors were colored according to their contribution to total variance: orange—low, blue—high. Blue dots represent controls: 1—empty flask, and 2—PDA medium; red dots—microorganisms with the most pronounced eigenvalues, black dots—microorganisms with less pronounced eigenvalues (cf. Table S2, Figure S1).

