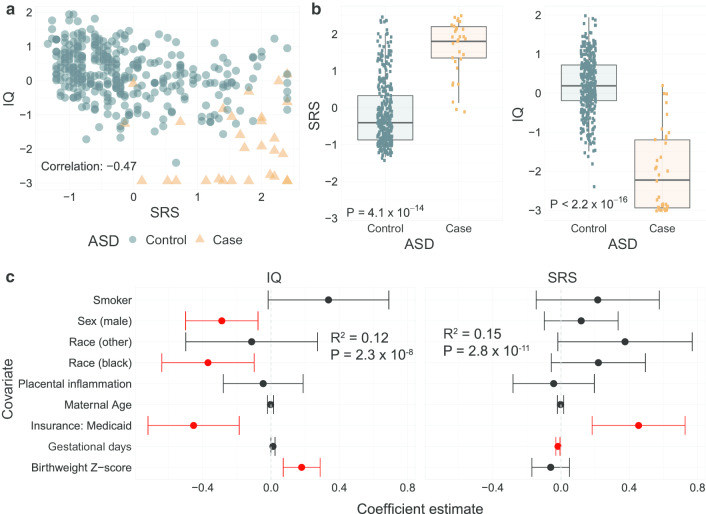
Fig. 2.
Associations between SRS, IQ, and ASD and with clinical variables. a Scatter plot of SRS (X-axis) and IQ (Y-axis) colored by ASD case (orange) and control (blue) status. b Boxplots of SRS and IQ across ASD case–control status. P value from a two-sample Mann–Whitney test is provided. c Caterpillar plot of multivariable linear regression parameters of IQ and SRS using clinical variables. Points give the regression parameter estimates with error bars showing the 95% FDR-adjusted confidence intervals [48]. The null value of 0 is provided for reference with the dotted line

