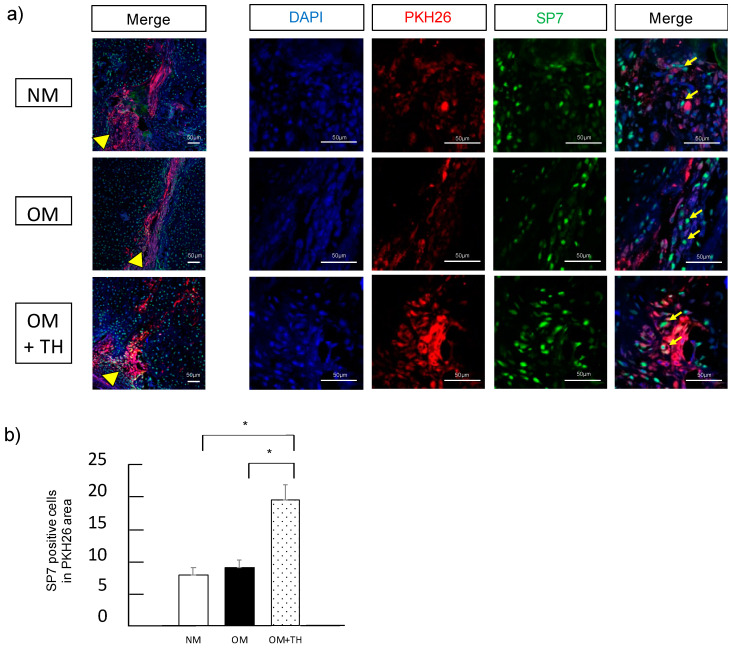
Figure 4.
Immunofluorescence analysis of callus induced by transplantation of DPSCs; PKH26-labeled DPSCs were cultured in NM, OM, or OM with TH before transplantation. (a) fractured tibiae were stained with SP7 after DPSC transplantation. Nuclei were visualized by DAPI in blue. PKH26 is shown in red and SP7 is shown in green. The arrowheads indicate the fracture line. The arrows indicate cells that are positive for both PKH26 and SP7. (b) quantification of SP7-positive cells. Data are shown as means ± SEM. * p < 0.05 by one-way ANOVA. Bars, 50 μm.

