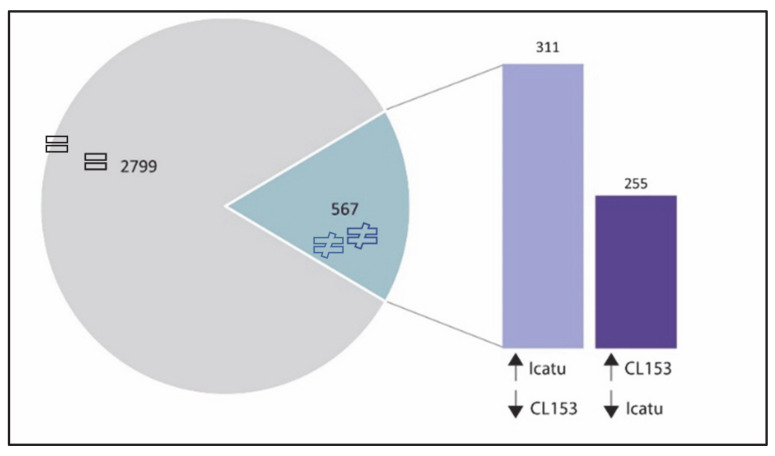
Figure 4.
Expression patterns of DEGs commonly expressed by both genotypes to eCO2. Pie chart: = indicates DEGs with the same pattern of regulation between genotypes while ≠ indicates DEGs with opposite regulations between genotypes. Bars indicate DEGs up-regulated in one genotype and down-regulated in the other.

