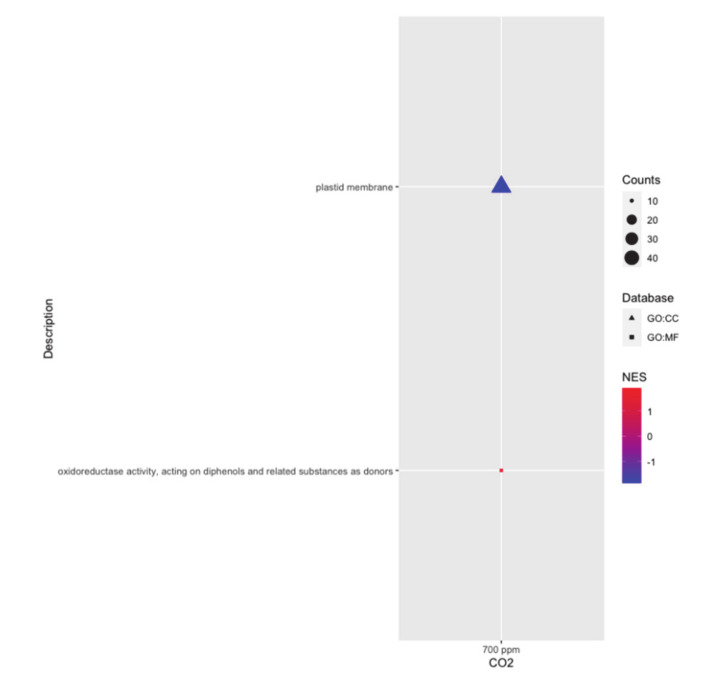
Figure 6.
Gene Set Enrichment Analysis (GSEA) performed by WEB-based Gene SeT AnaLysis Toolkit (WebGestalt). Significantly (FDR < 0.05, p< 0.001) enriched Gene Ontology (GO) terms among down- and up-regulated differentially expressed genes (DEGs) ranked by increasing log2 fold-change (FC), considering the response between CL153 and Icatu genotypes under aCO2 (left) and eCO2 (right). Gene Ontology (GO) terms are grouped by main category – Molecular Function (GO:MF) and Cellular Component (GO:CC). Counts indicate the number of DEGs annotated with each term/pathway and dots are colored by ascending normalized enrichment score (NES).

