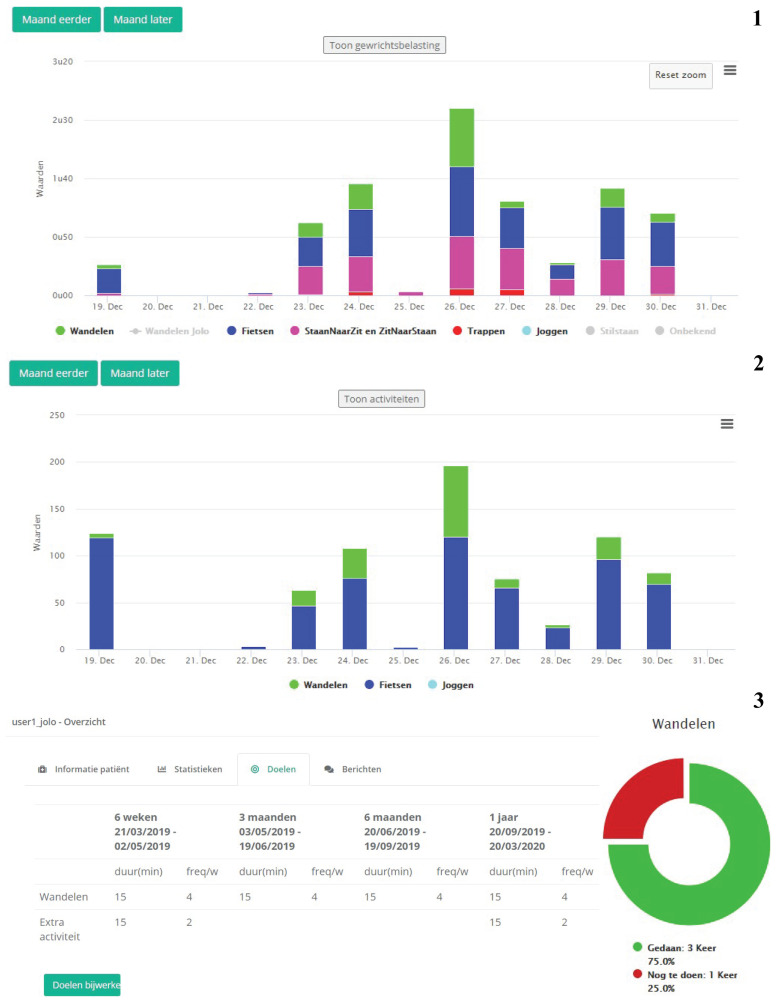
Figure 2.
Screenshots of the (1) activities, (2) functional status, and (3) goal screen of the clinical dashboard for the health-care professionals. The activities are displayed in stacked bar graphs per day for walking (=wandelen), cycling (=fietsen), sit-to-stand (ZitNaarStand), stand-to-sit (=StaanNaarZit), and running (=joggen). The second graph shows the corresponding functional status for that time period. The third overview shows the goals (=Doelen) for each time period. The considered time periods are 6 weeks (=weken), 3 months (=maanden), 6 months (=maanden), and 1 year (=jaar).

