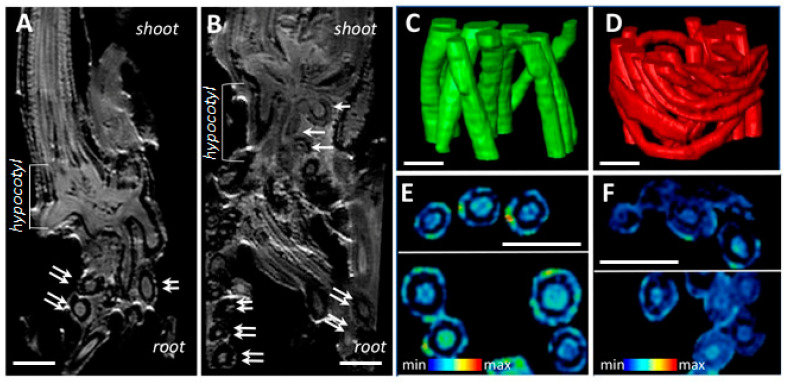
Figure 2.
Comparative non-invasive magnetic resonance imaging (MRI) revealed structural changes in SST roots of H. marinum when compared to the control. (A,B) The representative virtual cross-sections show the internal structure of hypocotyl regions of plants growing under the control condition (A) and SST (B). Numerous root nodules in the hypocotyl region (white arrows) and root cross-sections (doubled arrows) are visible. (C,D) Fragments of the 3D models show spatial arrangement of the fibrous roots in control (C, green) and SST (D, red). (E,F) Relative differences in water distribution across the root tissues are visualized in virtual cross-sections of control (E) and SST (F) roots. MRI signal in (E,F) is at an identical scale and represented using a rainbow-based color scheme. High signal intensities in red (max) indicate high water saturation, while the blue regions (min) indicate lower water saturation. Scale bars = 1 mm.

