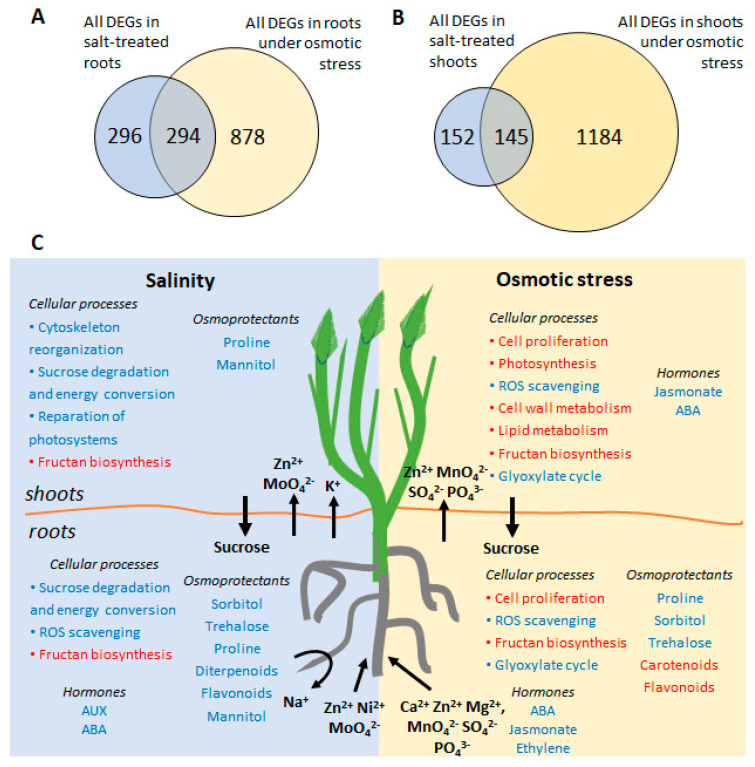
Figure 7.
(A,B) Venn diagram showing the numbers of common and stress-specific differentially expressed genes (DEG) in roots (A) and shoots (B) after osmotic (15% PEG6000) and salt (300 mM NaCl) stresses. (C) A schematic overview of the main processes occurred during salinity and osmotic stress in H. marinum. Activated processes are highlighted in blue, inhibited processes are highlighted in red. Arrows indicate directions of mineral, phytohormone, and sugar redistribution between roots and shoots upon stress treatment.

