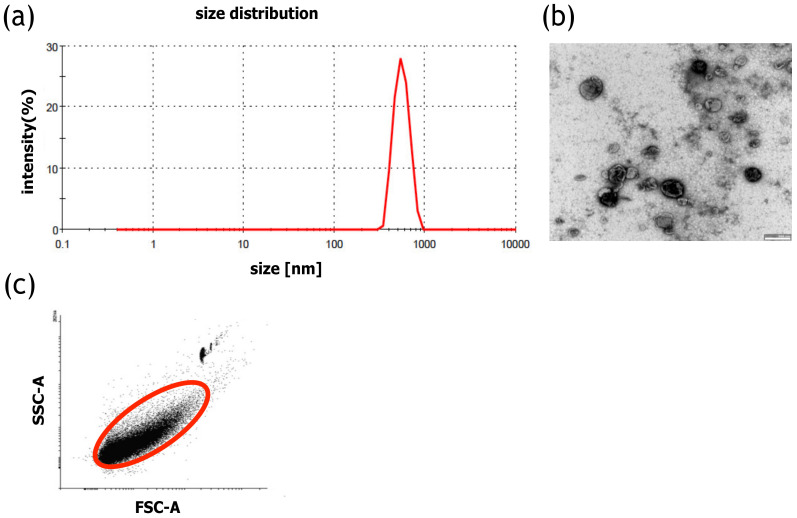
Figure 1.
Characteristics of HATMSC2-MVs (a) Representative HATMSC2-MV size distribution histogram obtained using dynamic light scattering analysis. (b) Representative transmission electron microscopy image of HATMSC2-MVs, bars represent 500 nm. (c) Representative dot plot showing forward scatter (FSC) vs. side scatter (SSC). Gate R-1 shows the population of HATMSC2-MVs, and gate R-2 represents the counting beads. HATMSC2-MVs—microvesicles derived from immortalized human mesenchymal stem cells of adipose tissue origin.

