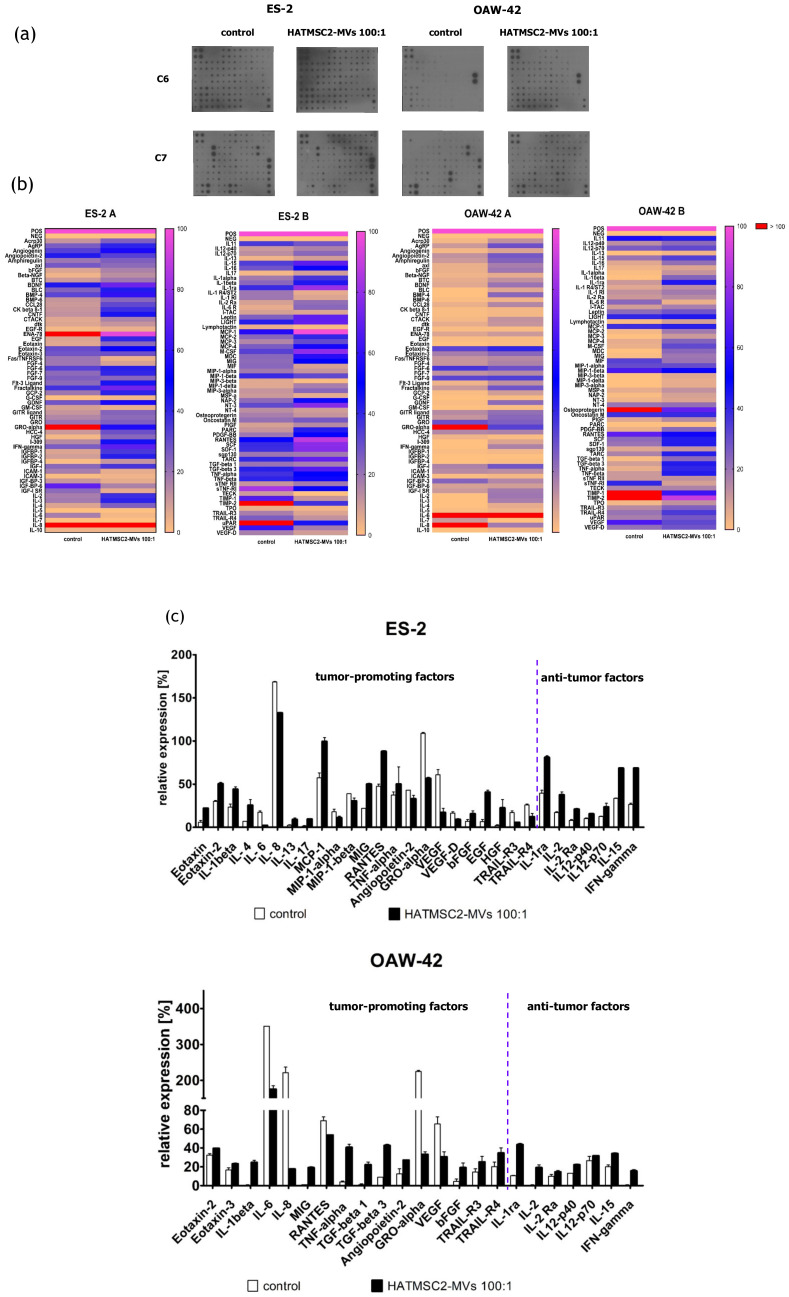
Figure 8.
Effect of HATMSC2-MVs on the secretion profiles of ovarian cancer cell lines. (a) Scans of representative antibody arrays for ES-2 and OAW-42 supernatants. Untreated cells served as a control. The signal intensity for each antibody spot is proportional to the relative concentration of the antigen in the sample. (b) Heat map of cytokine levels for the ES-2 and OAW-42 supernatants; magenta and yellow indicate higher and lower expression limits, respectively. Outstanding values (above 100% of positive control) are depicted in red. Data are normalized to the internal positive control spots, which are consistent between the arrays and represent 100%. The data represent the mean from a duplicate assessment. (c) Column graph representing selected proteins (equal to or above 10% of the positive control). The data are presented as mean ± SEM values from a duplicate assessment. HATMSC2-MVs—microvesicles derived from immortalized human mesenchymal stem cells of adipose tissue origin.

