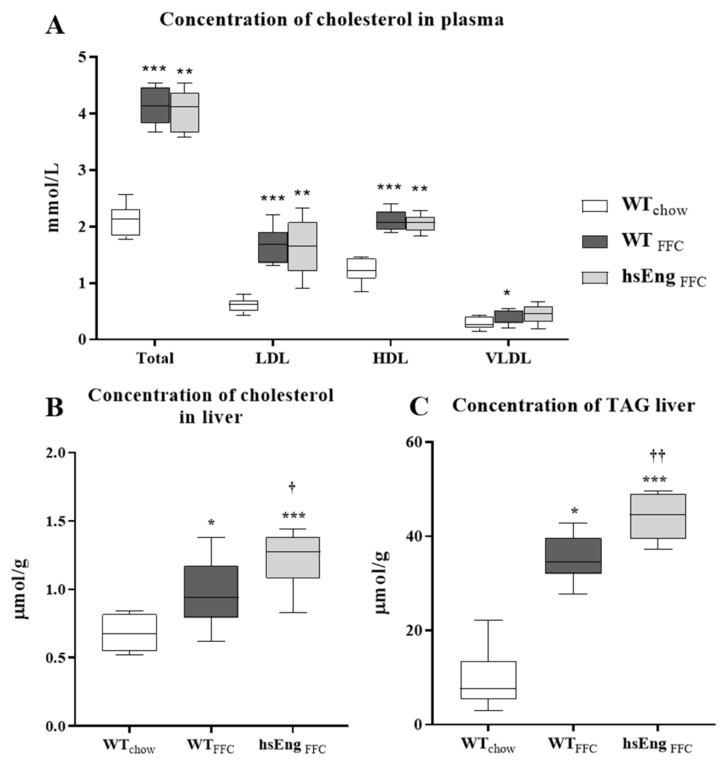
Figure 4.
Cholesterol levels in blood and cholesterol and TAG concentration in mice liver. Cholesterol concentration in plasma (A). The concentration of cholesterol (B) and TAG (C) in the liver. The data are presented as median with box and whiskers representing the interquartile range and 5th–95th percentiles (n = 8). * p < 0.05, ** p < 0.01, *** p < 0.001, using the Kruskal–Wallis test; † p < 0.05, †† p < 0.01, using the Mann–Whitney test (WTFFC–hsEngFFC).

