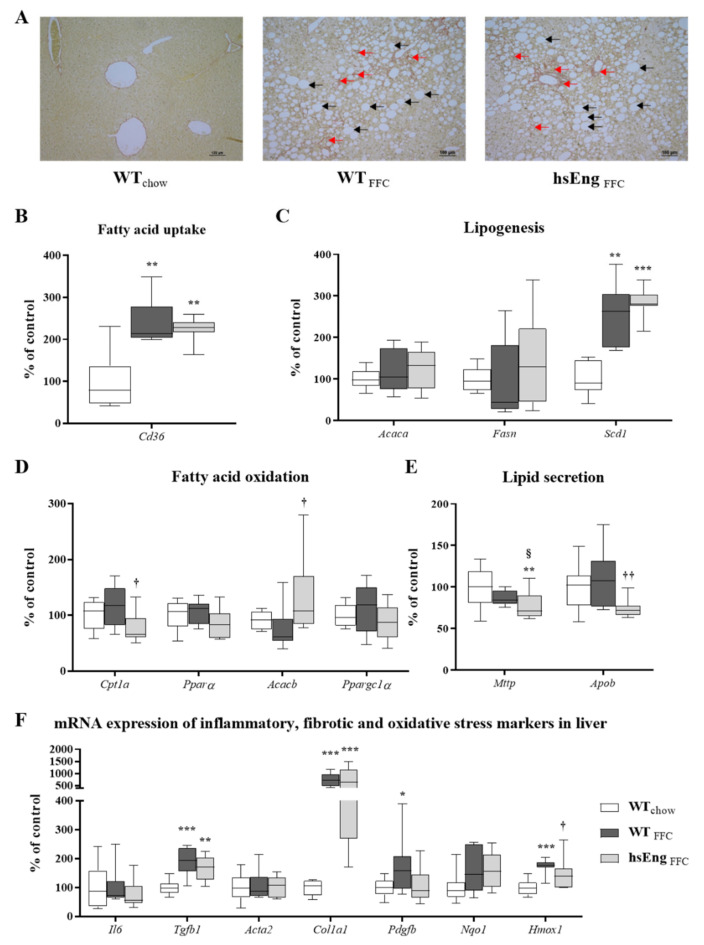
Figure 5.
Evaluation of steatosis, fibrosis, inflammation, and oxidative stress in the liver. Sirius red-stained liver sections [macrovesicular steatosis–black arrows and mild fibrosis–red arrows] (A). mRNA expression of genes involved in FA uptake (Cd36) (B), lipogenesis (Acaca, Fasn, Scd1) (C) and oxidation (Cpt1a, Pparα, Acacb, Ppargc1α) (D). mRNA expression of genes involved in lipid secretion (Mttp, Apob) (E). Gene expression of inflammatory (Il6), fibrogenic (Tgf-β1 , Acta2, Col1a1, Pdgfb) and oxidative stress (Nqo1, Hmox1) markers (F). The data are presented as median with box and whiskers representing the interquartile range and 5th–95th percentiles (n = 8). * p < 0.05, ** p < 0.01, *** p < 0.001, using the Kruskal–Wallis test; † p < 0.05, †† p < 0.01 using the Mann–Whitney test (WTFFC–hsEngFFC); § p = 0.065 using the Mann–Whitney test (WTchow–WTFFC).

