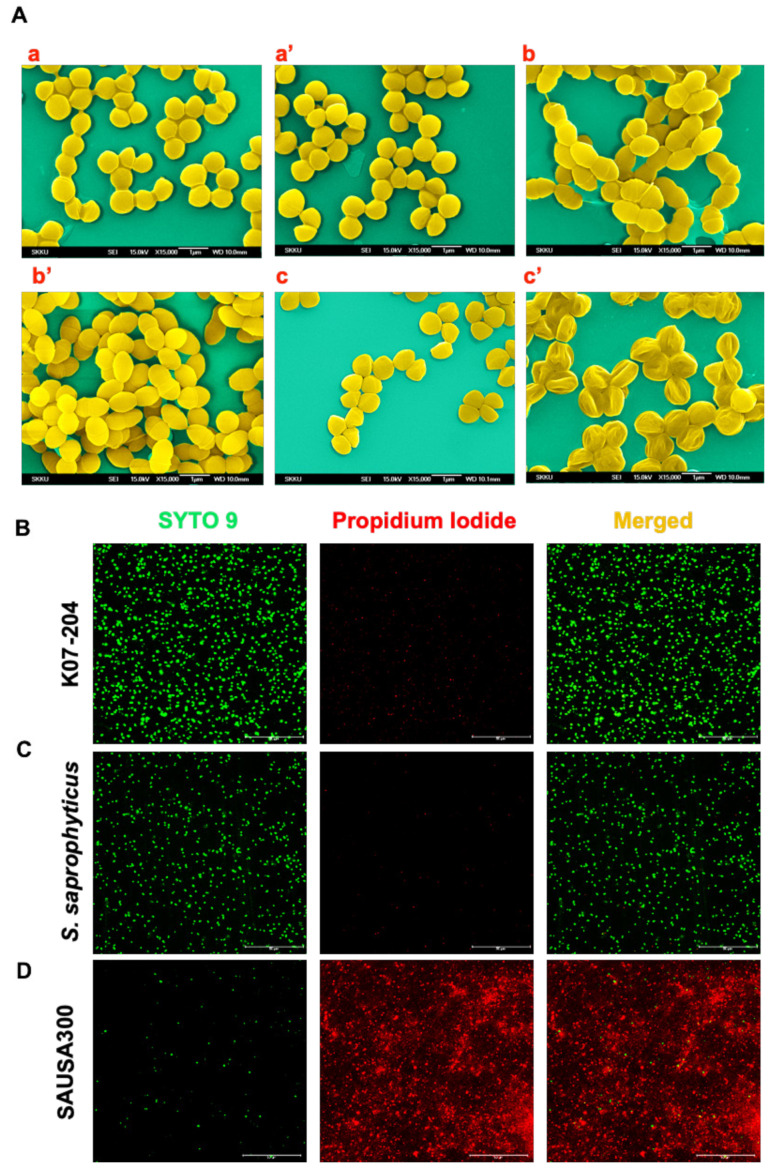
Figure 3.
Confirmation of lysostaphin-mediated alteration in the cell wall and consequent cell death. (A) Scanning electron microscopy (SEM) to visualize the alteration in the cellular morphology showing staphylococcal cells without lysostaphin treatment wherein K07-204 (a); S. saprophyticus (b); and SAUSA300 (c); and after lysostaphin treatment K07-204 (a’); S. saprophyticus (b’); and SAUSA300 (c’). Both K07-204 and S. saprophyticus (lysr) did not show any alteration, while the SAUSA300 (lyss) cells were shrunk upon lysostaphin treatment due to the catalytic cleavage activity of lysostaphin; (B–D) Confocal microscopy images of live/dead staining of ST72 resistant isolates and its comparison with SAUSA300 to assess the consequent proportion of live/dead staphylococcal cells, wherein SYTO9 stains the total cells (green), whereas propidium iodide (PI) exclusively stains dead cells (red). Both K07-204 (B) and S. saprophyticus (C) showed a lower number of dead (red) cells compared to SAUSA300 (D) upon 2 U of lysostaphin treatment.

