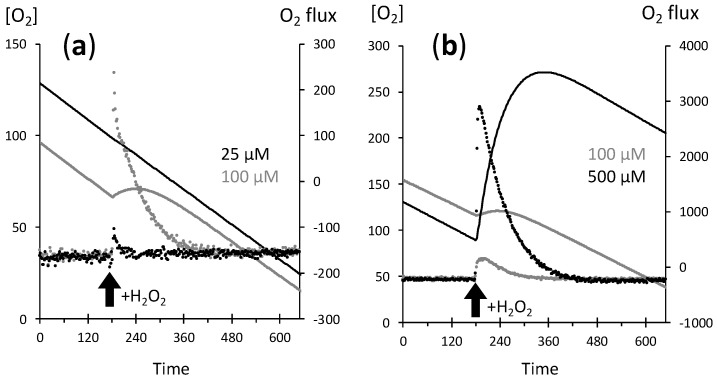
Figure 1.
O2 release upon H2O2 addition. Chinese hamster ovary (CHO) cells suspension at approx. 2 × 10⁶ cells/mL; X axis = time in seconds; left Y axis = recorded oxygen concentration expressed in µM (lines); right Y axis = oxygen flux rate in pmol/(s.mL) calculated over a two second interval (dots); and thick upward black arrow = H2O2 addition performed at time 180 s. The stable negative value of oxygen rate before H2O2 addition is the oxygen consumption due to cellular respiration. Different H2O2 additions are represented: (a) 25 µM (black symbols) or 100 µM (grey symbols) H2O2 in the cellular suspension, (b) 500 µM (black symbols) or 100 µM (grey symbols) H2O2 in the cellular suspension.

