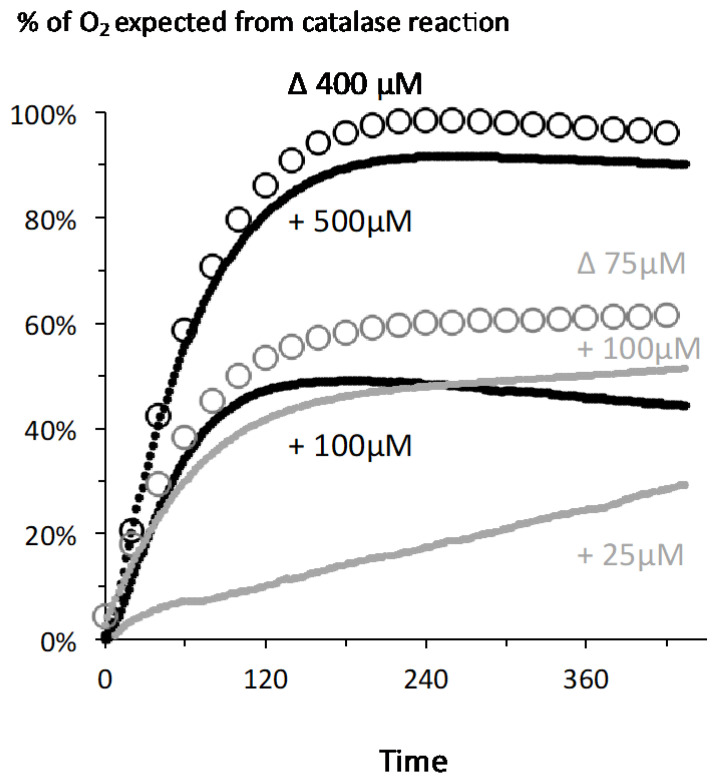
Figure 2.
Increase in oxygen content in the medium compared to a full catalase reaction: X axis = time in seconds with addition of H2O2 considered as zero time; Y axis = oxygen release expressed as percentage of the amount expected from a 100% yield for the catalase reaction (O2 = ½ H2O2). The two experiments presented in Figure 2a are in black symbols (+100 and +500 µM H2O2) while those presented in Figure 2b are in grey (+25 µM and +100 µM). Empty symbols represent results obtained when subtracting the oxygen release in the two concomitant chambers, i.e., either 100 − 25 = 75 µM H2O2 or 500 − 100 = 400 µM, with one data point out of ten shown for the sake of clarity.

