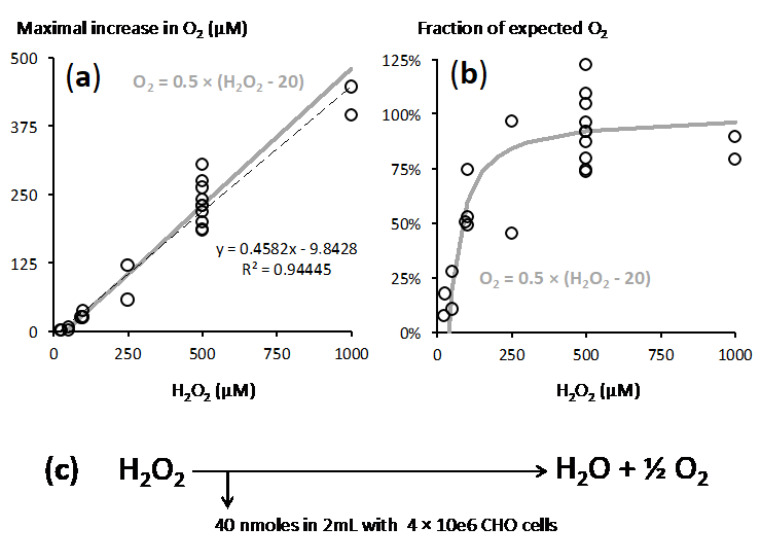
Figure 3.
Recapitulation of experimental data led to a model for the reaction between H2O2 and CHO cells. CHO cells suspension ranged from 1.5 to 2.2 × 10⁶/mL. (a) X axis = final H2O2 concentration in the medium, Y axis = maximal observed increase in O2 (see Figure 2 for an example); dotted black line = linear fitting according to the equation shown in grey (with values in µM) in the panel upper part; grey lines = released oxygen given by the predicted equation of the model. (b) Expression of these O2 increases as percentage of the value expected from full engagement into catalase reaction, same X axis and symbols as in panel a. (c) Resulting model: upon H2O2 addition, 40 nanomoles H2O2 are immediately engaged in reactions not leading to O2 release; the rest of H2O2 is subjected to catalase action.

