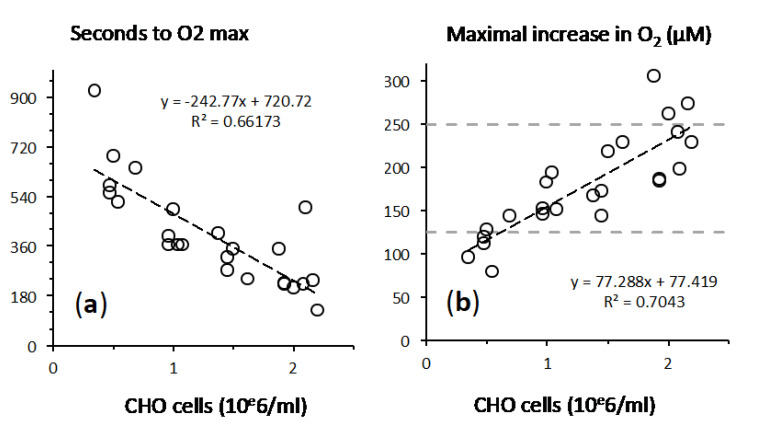
Figure 4.
Influence of cell density on O2 release. X axis = concentration of CHO cells exposed to a single addition of 500 µM H2O2. (a) Time delay to reach the maximal O2 increase, inverse to the reaction rate. (b) O2 release in µM with dotted grey lines figuring the values corresponding to a 50% and 100% yield of O2 recovery from the catalase reaction (125 µM and 250 µM).

