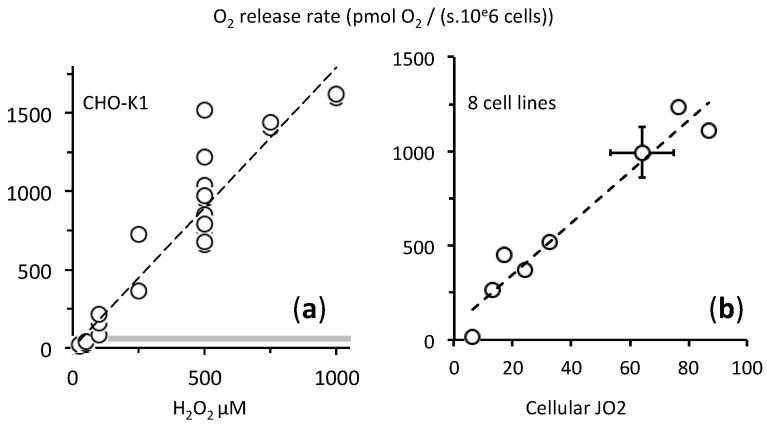
Figure 5.
High initial rates of O2 reflect the catalytic efficacy of catalase reaction. Y axis = initial O2 release rate determined over 10 to 40 s after H2O2 injection; (a) X axis = H2O2 final concentration after injection; CHO-K1 cells suspension were in the range 1.5 to 2.2 × 10⁶ cells/mL; thick grey line = CHO-K1 cellular oxygen consumption (≈60 pmol O2/(second × 106 cells) given for comparison’s sake; dotted line = linear fitting, which suggested the absence of saturation up to 1 mM H2O2. (b) The catalase initial rate after 500 µM H2O2 injection was determined with eight different cell lines. X axis = endogenous cellular oxygen consumption rate (respiration) before the single 500 µM H2O2 addition. The different cell types are listed according to increasing X values: human lymphoblasts (HPB-All, Jurkat, DND, Molt4), human immortalized skin fibroblast, CHO-K1 ± SD (n = 21 more data than in (a), cell density from 0.35 to 2 × 10⁶ cells/mL), osteosarcoma 143B, and human neuroblastoma (SH-SY5Y). The dotted line represents linear fitting with values Y = 14x + 75 with R2 = 0.94.

