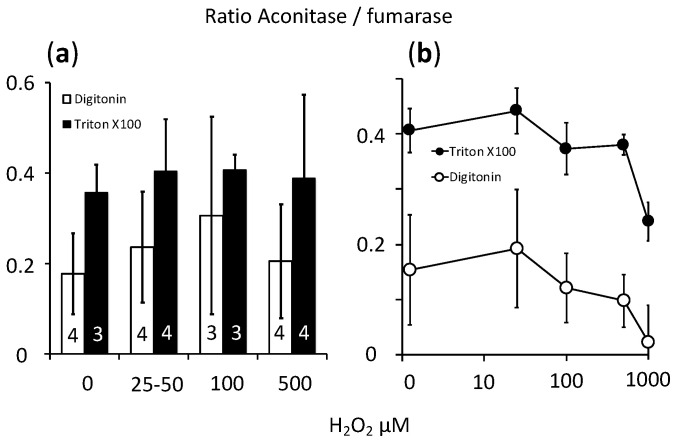
Figure 6.
Evaluation of cellular oxidative stress using the aconitase to fumarase ratio in CHO cells exposed to H2O2. Y axis = aconitase to fumarase ratio; X axis = H2O2 concentration. (a) Empty bars = values observed in cells treated with digitonin (cytosolic activities); filled bars = values observed in cells treated with Triton X100 (both cytosolic and mitochondrial activities); values expressed as mean ± SD; the number of independent experiments is indicated at the bottom of the histogram bars. (b) Single experiment with the concentration of H2O2 raised to 1 mM; values expressed as mean and SD of the wells observed in that experiment.

