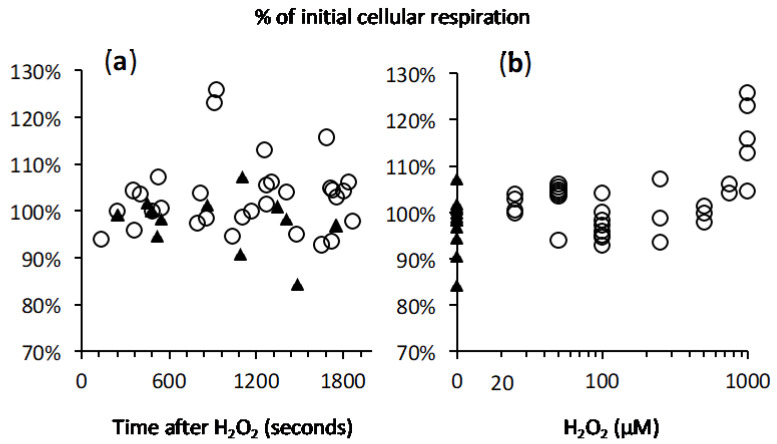
Figure 7.
Absence of impact of H2O2 on CHO cells respiration. Y axis = cellular oxygen consumption after H2O2 had been exhausted and expressed as percent of the initial rate (rate recorded just before H2O2 addition). (a) X axis = lag time between H2O2 addition and measurement oxygen consumption rate; black triangles refer to concomitant control experiments (without H2O2). (b) X axis = amount of H2O2 injected in the experiments represented in panel a.

