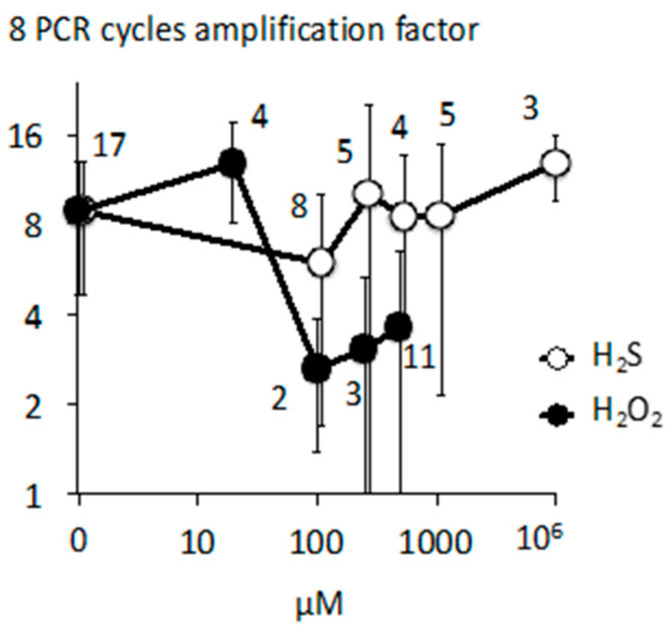
Figure A1.
Quantitation of mitochodrial DNA damage: DNA was prepared from CHO cells exposed to Na2S (H2S) or H2O2. qPCR of samples compared with that of a known amount of target sequence allowed absolute quantitation. This quantitative measurement was made either directly with CHO DNA preparation or after eight cycles of a long PCR amplifying a 8Kb fragment of mitochondrial DNA (2976–11031) including the qPCR target sequence (6744–6918). Therefore, after the long PCR the theoretical amplification factor of the mtDNA target sequence is 64 times. The graph represents the experimental amplification factor (Y axis) when cells were exposed to increasing concentrations (X axis) of H2S (empty symbols) or H2O2 (filled symbols). The number of experiments (independent treatment with H2O2 or H2S) is indicated. A log scale is used for both axes with following modifications: H2S values are represented with X values 10% higher than reality, this allows distinction of error bars, the 106 value (1M) Na2S is represented as if 104.

