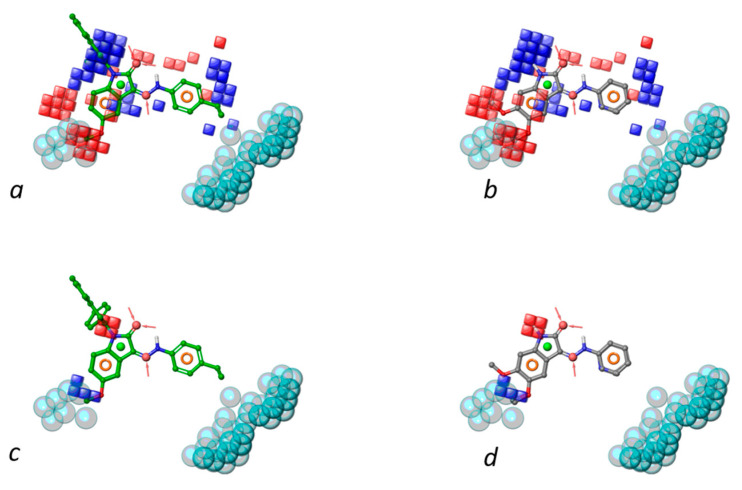
Figure 6.
Contour maps rendered as blue and red cubes indicate positive and negative regions for activity. Specifically, panels (a,c,e) show the most active ligands within hydrophobic, HBD and electron withdrawing region, respectively; panels (b,d,f) show the most inactive ligands within hydrophobic, HBD and electron withdrawing regions, respectively. Pharmacophore features and excluded volumes are also reported.


