Table 5.
Inhibition of β-amyloid and tau aggregation.
| Code | Structure | Aβ40 Inhibition | Tau Inhibition a | ||
|---|---|---|---|---|---|
| % at 100 μM | IC50 (μM) | % at 10 μM | IC50 (μM) | ||
| S22 b |
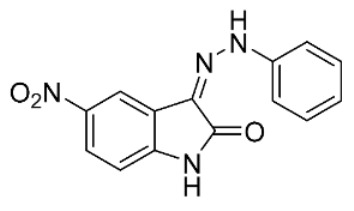
|
-c | 15 ± 3 | ||
| S23 b |
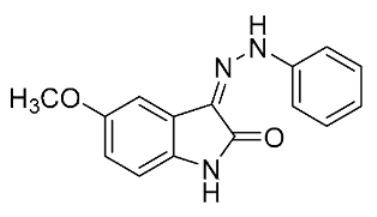
|
52 | 7.7 ± 1.0 | ||
| S34 b |
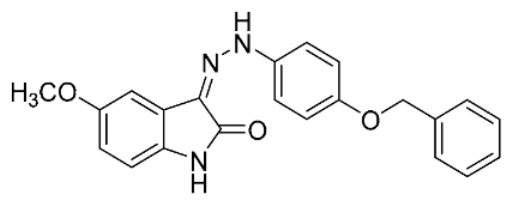
|
20 | 16 ± 2 | ||
| S35 b |
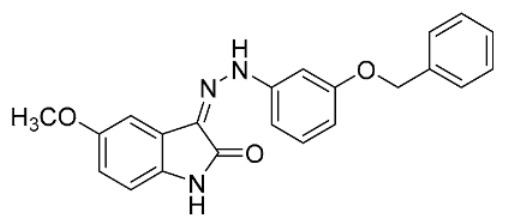
|
44 | 10 ± 2 | ||
| 4 |

|
31 ± 3 | 17 ± 2 | ||
| 5 |
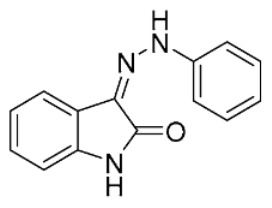
|
22 ± 2 | 4.6 ± 0.7 | ||
| 6 |

|
45 ± 6 | 14 ± 2 | ||
| 7 |
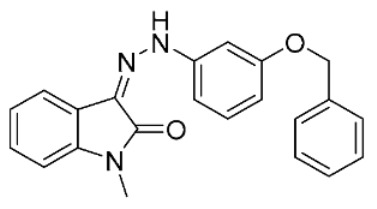
|
2.0 ± 0.3 | 19 ± 2 | ||
| 8 |

|
69 ± 3 | 35 ± 2 | ||
| 9 |

|
0.95 ± 0.04 | 20 ± 2 | ||
a From cell-based assay. b Compounds and their data of β-amyloid aggregation are taken from ref. [16] and presented in Supplementary Materials. Values are mean ± SEM (n = 3) in in vitro assay. c No inhibition at 100 μM concentration.
