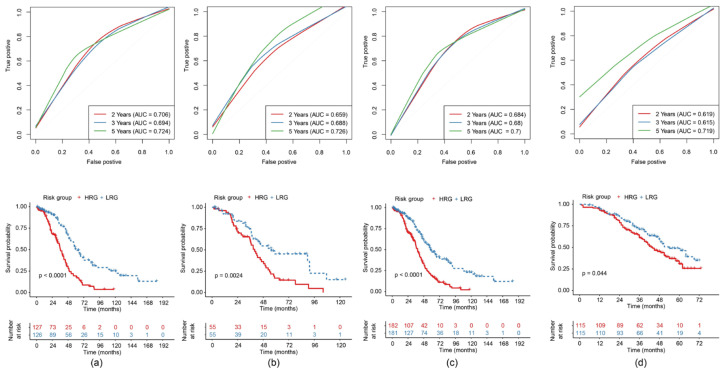
Figure 4.
Construction and evaluation of the 11-gene risk model with each receiver operating characteristic (ROC) curve (area under the curve (AUC) of the 2-year, 3-year and 5-year predictive effect) above and the KM (Kaplan-Meier) curve comparing high-risk group (HRG) and low-risk group (LRG) beneath for: (a) TCGA training cohort; (b) TCGA testing cohort; (c) TCGA-(epithelial ovarian cancer (EOC) cohort; (d) GEO Series 32026 (GSE32026) cohort.

