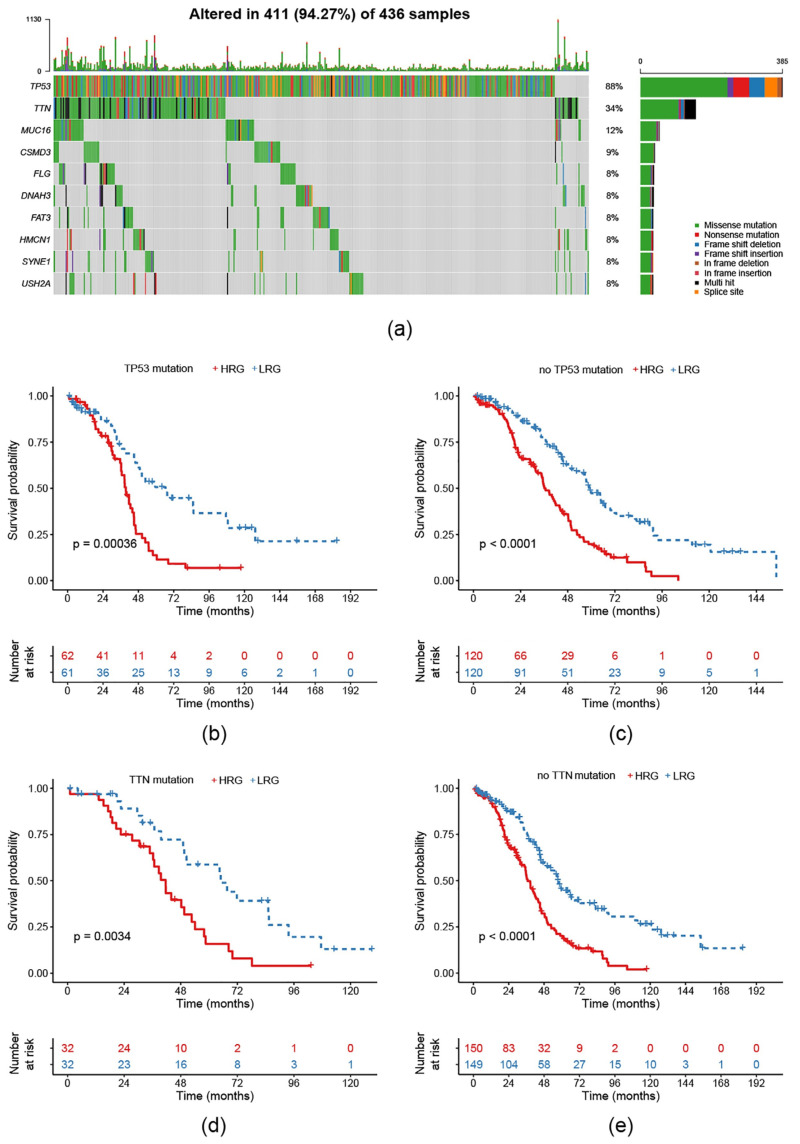
Figure 6.
Analysis of the 11-gene signature model in different single nucleotide mutations: (a) Distribution of common single nucleotide mutations in EOC with 94.27% samples altered; (b) KM curve of TP53-mutated samples; (c) KM curve of not TP53-mutated samples; (d) KM curve of TTN-mutated samples; (e) KM curve of not TP53-mutated samples.

