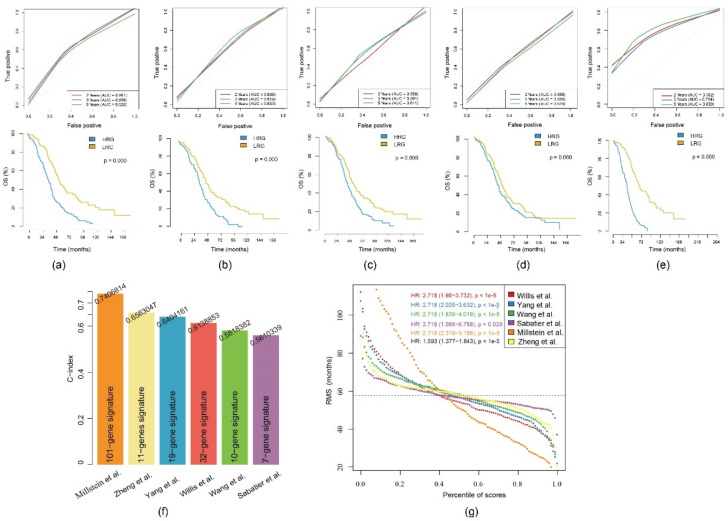
Figure 9.
Comparison of the 11-gene risk model with other models: (a) The ROC and KM curves of the 19-gene signature (Yang et al.); (b) the ROC and KM curves of the 32-gene signature (Willis et al.); (c) the ROC and KM curves of the 10-gene signature (Wang et al.); (d) the ROC and KM curves of the 7-gene signature (Sabatier et al.); (e) the ROC and KM curves of the 101-gene signature (Millstein et al.). (f) Concordance indexes (C-indexes) of the six prognostic risk models; (g) Restricted mean survival (RMS) time curve of the six prognostic risk models (the dashed line indicates the overlap of 58 months).

