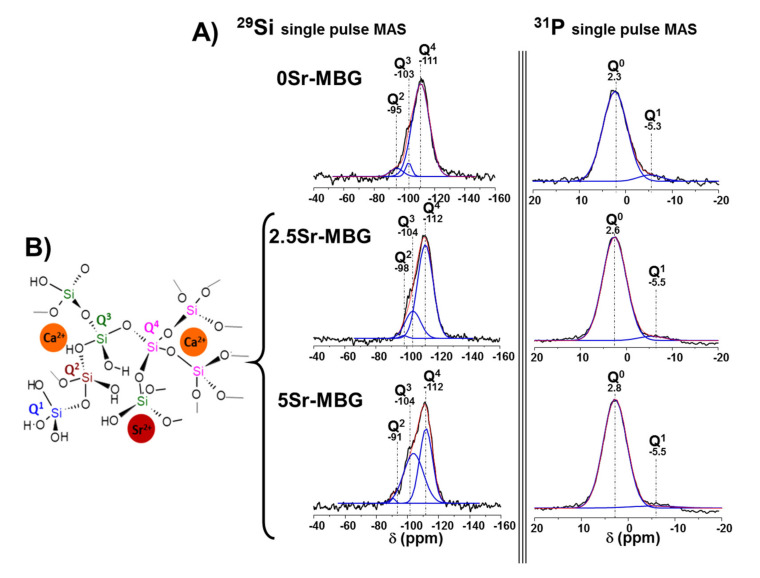
Figure 3.
(A) Solid-state 29Si and 31P single-pulse magic angle spinning nuclear magnetic resonance (SP MAS-NMR) spectra of MBG samples. Qn areas were calculated by Gaussian line–shape deconvolution and are displayed in green. (B) Graphical representation of the silica structure of 0, 2.5 and 5Sr-MBG. The error associated to the fitting was the difference between the black and red lines.

