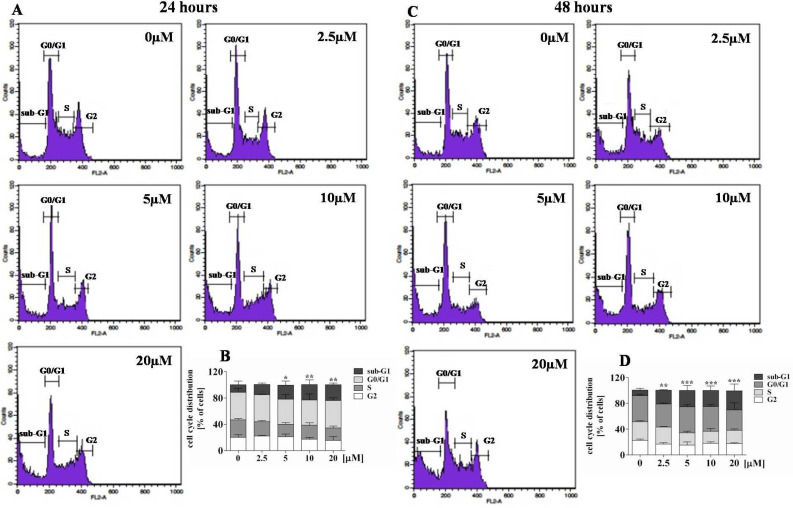
Figure 4.
Effect of compound 3a on cell cycle distribution in the RPMI 8226 cell line. After the treatment with various concentrations of compound 3a for 24 and 48 h, the cells were stained with propidium iodide and analyzed by flow cytometry. Representative DNA histograms after 24-h (A) and 48-h (C) treatment. Statistical analysis of the percentages of cells in the sub-G1, G0/G1, S, and G2 phases after 24-h (B) and 48-h (D) treatment. Data (n = 6 for each concentration) are presented as the mean ± SD of three independent experiments; * p < 0.05, ** p < 0.01 and *** p < 0.001 in comparison to the control; one-way ANOVA test.

