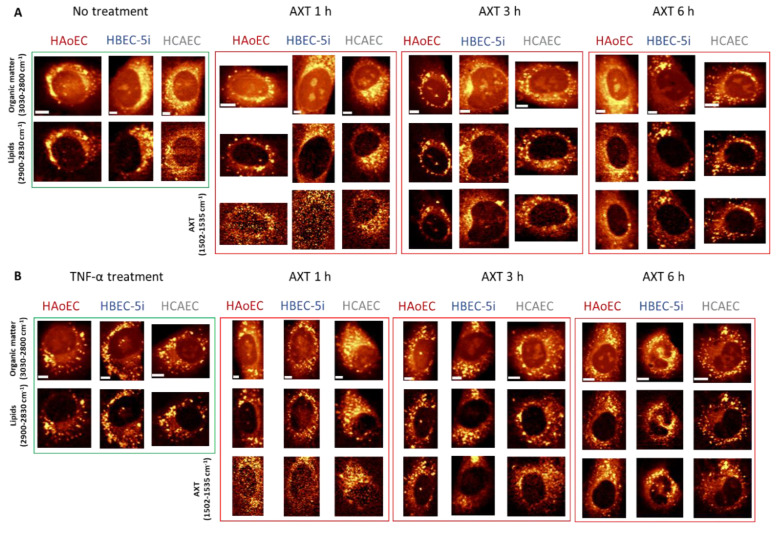
Figure 4.
Representative Raman images of non-treated (A) and TNF-α-stimulated (B) endothelial cells incubated with AXT for 1, 3 and 6 h. Raman images of endothelial cell lines HAoEC, HBEC-5i and HCAEC were obtained by the integration of Raman bands over the selected spectral regions: 3030–2830 cm−1 (organic matter), 2900–2850 cm−1 (lipids) and 1530–1500 cm−1 (AXT). Scale bars equal 5 µm.

