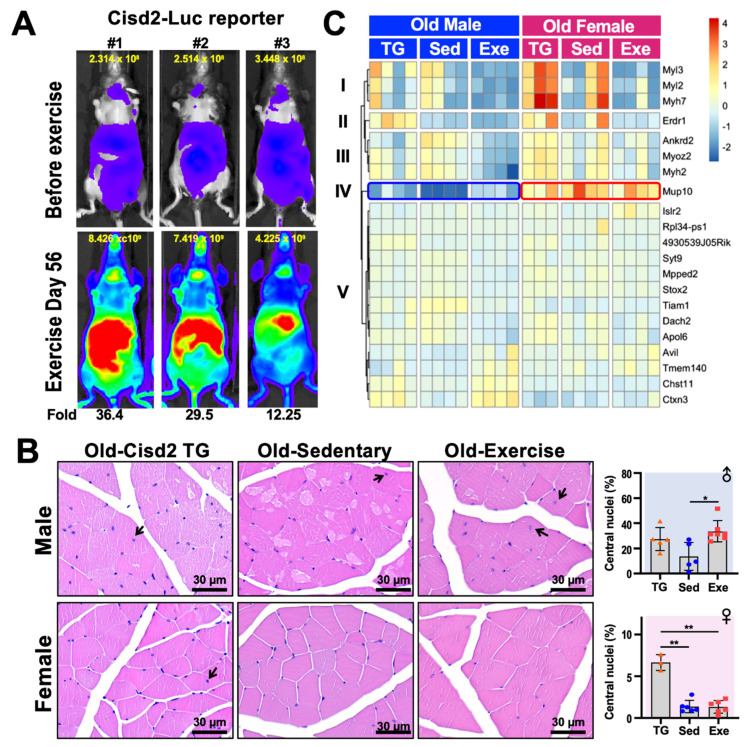
Figure 2.
Histology and transcription analysis of femoris muscle from mice that have practiced long-term exercise. (A) Luciferase activity in Cisd2-Luc reporter mice before and after 56-days of treadmill exercise. The treadmill protocol was 6 m/min for 5 min, 9 m/min for 5 min, 12 m/min for 20 min, 15 m/day for 5 min and 12 m/day for 5 min, for a total of 450 m/day. The Cisd2-Luc reporter mice ran on treadmills at a frequency of 5 days/week for 8 weeks (56 days). The quantification of luciferase intensity in each of the mice in the figure is shown at top of each image. Increased (fold change) Cisd2-Luc luciferase signals are numbered below the images; these represent mice after the exercise was completed. The photos were taken ventrally. (B) H&E staining of the femoris muscles of Cisd2-TG, Old-Sed and Old-Exe male and female mice. The arrows indicate myofibers that contain central nuclei. Bars: 30 μm. Percentage of central nucleation in each group of mice is presented on the right. The data are presented as means ± SD. Statistical analysis used the Student’s t-test. *, p < 0.05; **, p < 0.01. TG, Cisd2-TG; Sed, sedentary; Exe, exercise. (C) A heatmap showed the differentially expressed gene (RNA-Seq) clusters for the male and female femoris muscle that have been changed by long-term treadmill exercise. The RNA-seq data was analyzed by “DEseq2” and the DE genes were defined as LFC > 0.14 and FDR < 0.1. The heatmap was generated using the “pheatmap” R package (Raivo Kolde (2019). pheatmap: Pretty Heatmaps. R package version 1.0.12. https://CRAN.R-project.org/package=pheatmap) according to rlog transformed count calculated by “DEseq2”.

