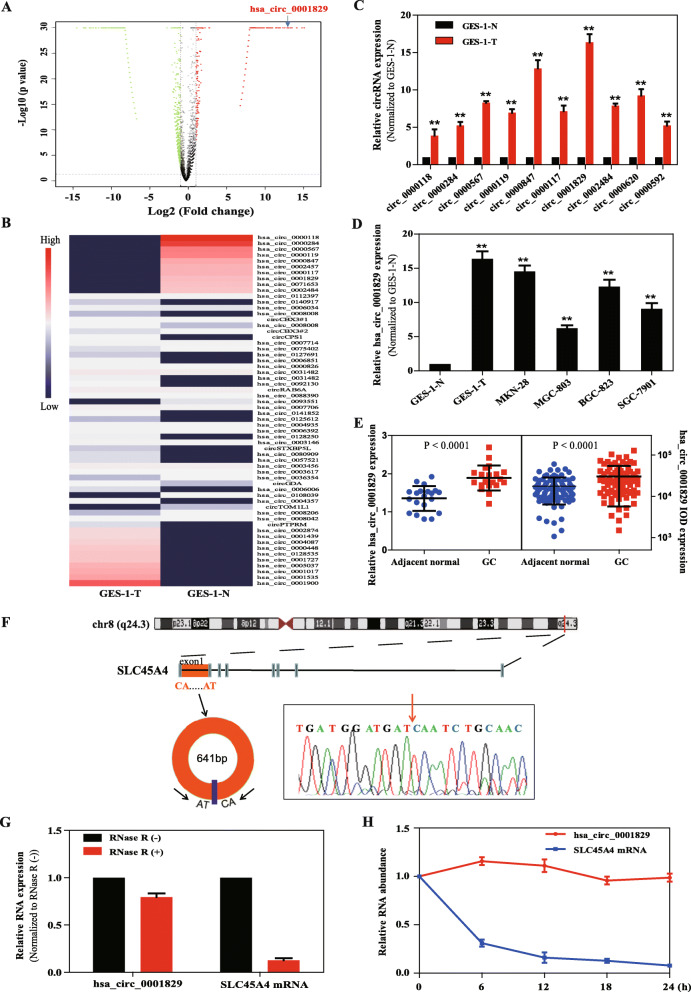
Fig. 1.
Screening and expression of hsa_circ_0001829 in gastric cancer cells. a Volcano plot of the differentially expressed circRNAs in GES-1-T and GES-1-N cells (FC ≥ 2 or FC ≤ 0.5 and P < 0.05). Significantly upregulated circRNAs are indicated in red and downregulated circRNAs are indicated in green. The blue arrow indicates hsa_circ_0001829. b Heat map of the differentially expressed circRNAs in GES-1-T and GES-1-N cells. Red indicates a higher fold-change and blue indicates a lower fold-change. c Expression of the top 10 upregulated circRNAs in GES-1-T compared with GES-1-N cells was detected via qRT-PCR. d Expression of hsa_circ_0001829 in four gastric cell lines compared with GES-1-N cells. e Expression of hsa_circ_0001829 in 20 patients with GC (P < 0.0001) and in a tissue microarray of 83 GC paired patients (P < 0.0001). f The genomic loci of the SLC45A4 gene and hsa_circ_0001829. Red arrow indicates the back-splicing of hsa_circ_0001829 confirmed by Sanger sequencing. f qRT-PCR analysis of hsa_circ_0001829 and SLC45A4 mRNA after treatment with RNase R in GES-1-T cells. g The abundance of hsa_circ_0001829 and SLC45A4 mRNA was, respectively, tested by qRT-PCR in GES-1-T cells treated with Actinomycin D at the indicated time points. *p < 0.05, **p < 0.01

