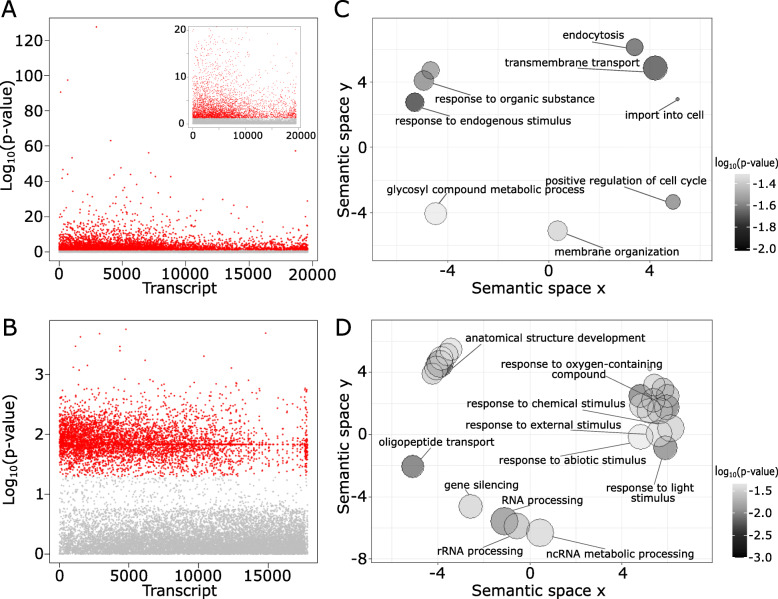
Fig. 6.
Latent Factor Mixed Models (LFMM) and similarity analysis for genes associated with edaphic variation in hybrid zones between Epidendrum fulgens and E. puniceoluteum. (a) Manhattan plot of 19,617 and 17,832 differently expressed transcripts (DETs) from ICA and (b) ICO hybrid zones, respectively. The plot represents minus log10 calibrated p-values obtained from LFMM. DETs with calibrated p-values < 0.05 (in red) are considered as significantly associated with the edaphic niche. (c) Semantic similarity analysis implemented in REVIGO showing representative (non-redundant) GO terms from enrichment analysis for DETs significantly associated to the edaphic niche of ICA and (d) ICO. The color of each bubble indicates the significance level of the GO term (darker bubbles have lower p-values in the enrichment analysis), while size indicates the frequency of the GO term in the UniProt database (bubbles of more general terms are larger)

