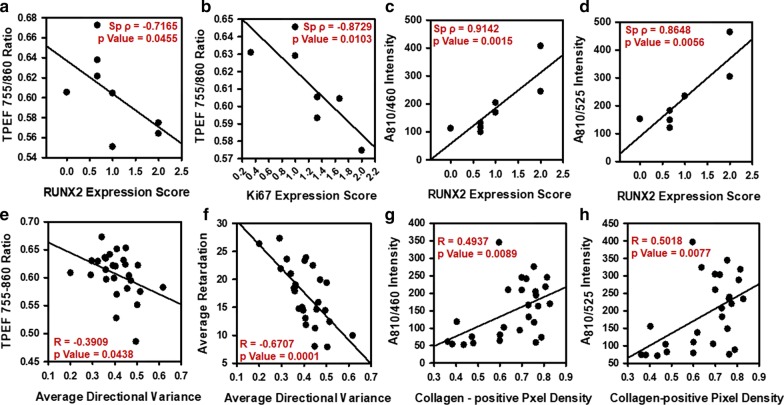
Fig. 6.
Correlation of TPEF Autofluorescence Ratios with Collagen remodeling and Osteogenic Protein Expression. TPEF 755–860 Ratio for commissures correlated with a RUNX2 expression and b Ki67 Expression score in control and pro-calcific mice for 4 and 16 weeks. c Average A810/460 intensity and d Average A860/525 intensity correlated with RUNX2 expression score in control and pro calcific mice for 4 and 16 weeks. e TPEF 755–860 Ratio correlated with average directional variance of collagen from leaflets, commissures and roots of control and pro calcific mice for 4 and 16 weeks. f Average retardation correlated with average directional variance of collagen from leaflets, commissures and roots of control and pro calcific mice for 4 and 16 weeks. g Average A810/460 intensity and h Average A860/525 intensity correlated with Collagen-positive pixel density from leaflets, commissures and roots of control and pro calcific mice for 4 and 16 weeks. N = 1–3. *p < 0.05. Correlations between TPEF Autofluorescence Ratios and Protein expression score: Spearman’s Rank Correlation; Correlations between TPEF Autofluorescence Ratios and Collagen remodeling metrics: Pearson’s correlation

