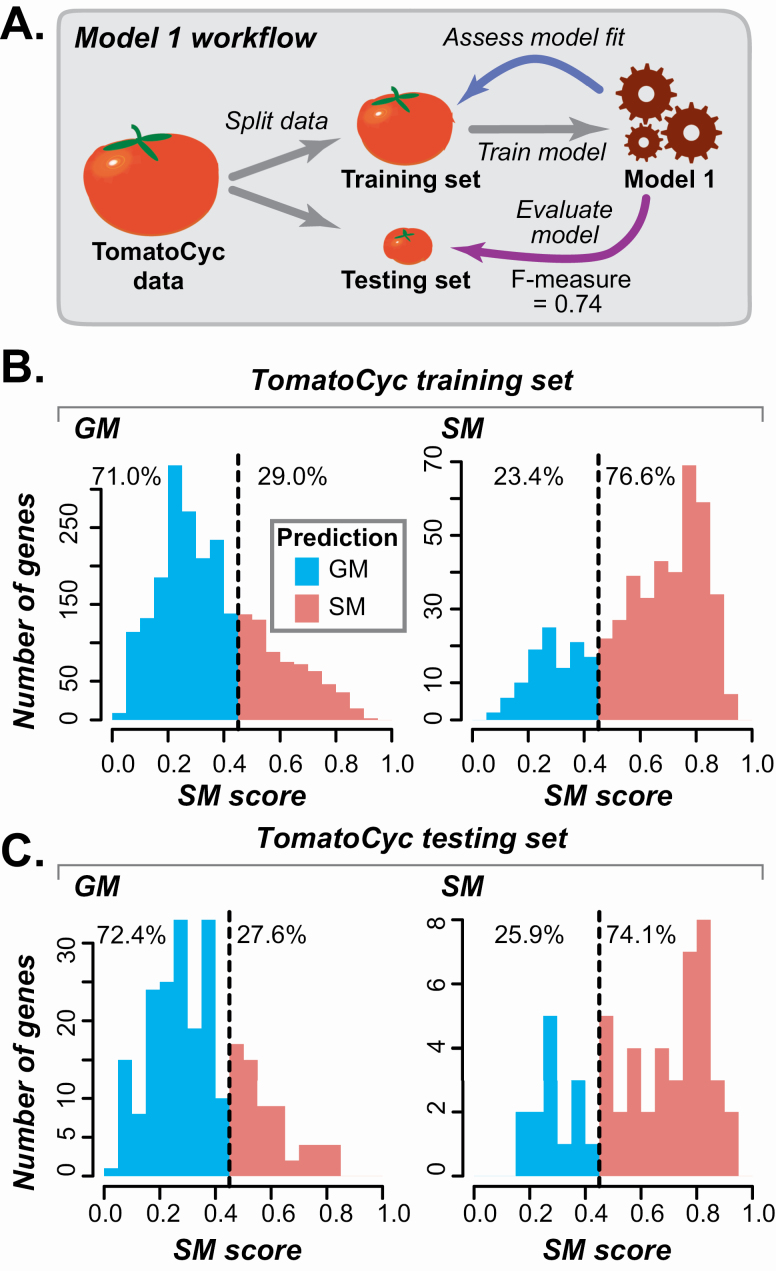
Figure 2.
Tomato-based Model 1 and its performance. (A) Schematic illustrating Model 1, in which a tomato data set with 7286 tomato features were used. The model was built using TomatoCyc annotations and applied to tomato genes. (B) Distribution of Model 1 SM gene likelihoods (SM scores) for the TomatoCyc-annotated SM and GM genes in the training set. Prediction threshold, based on the score with the highest F-measure, is indicated by the dotted line, and predicted GM (blue) and SM (red) genes are to the left and to the right of the line, respectively. Percentage values indicate the percent total genes predicted as GM or SM. (C) Distribution of Model 1 SM scores for testing SM and GM genes that were withheld from model training.

