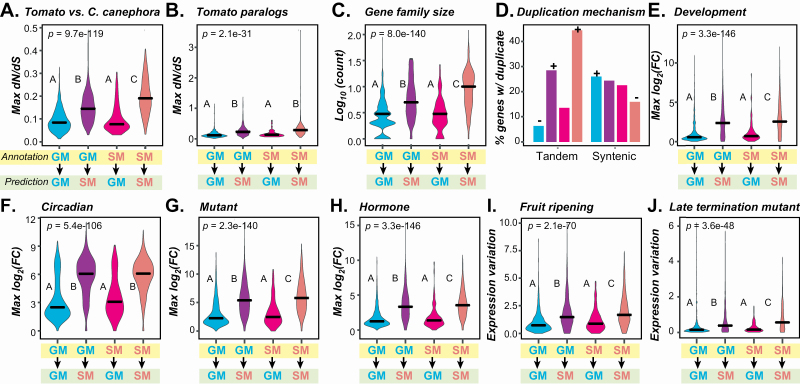
Figure 4.
Feature distributions of genes with predictions contrary to their annotated classification. (A) Maximum dN/dS values from comparisons of genes in four classes to homologs in C. canephora among four Annotation (yellow rectangle) and Prediction (green rectangle) classes. Blue: GM_GM, a GM gene predicted as GM. Purple: GM_SM: a GM gene predicted as SM. Magenta: SM_GM: an SM gene predicted as GM. Red: SM_SM: an SM gene predicted as SM. For this and subsequent figure depicting continuous data, P-values are from the Kruskal–Wallis test and post hoc comparisons were made using the Dunn’s test. Different letters indicate statistically significant differences between groups (P < 0.05). (B) Maximum dN/dS values of genes in four classes to their paralogs. (C) Log10 of gene family sizes. (D) Percentage of genes with at least one duplicates derived from tandem or syntenic mechanism. Colour scheme following that in (A). + and −: significant enrichment of SM and GM genes, respectively at 5 % significance level after Benjamin–Hochberg multiple testing correction. (E–H) Distributions of maximum fold change over the same expression data set as in Fig. 3F–I including (E) the meristem development, (F) the circadian, (G) mutant and (H) hormone treatments. (I and J) Distribution of fold change variation in two data sets: (I) fruit ripening (1 study, 12 samples) and (J) late termination mutant (1 study, 12 samples).

