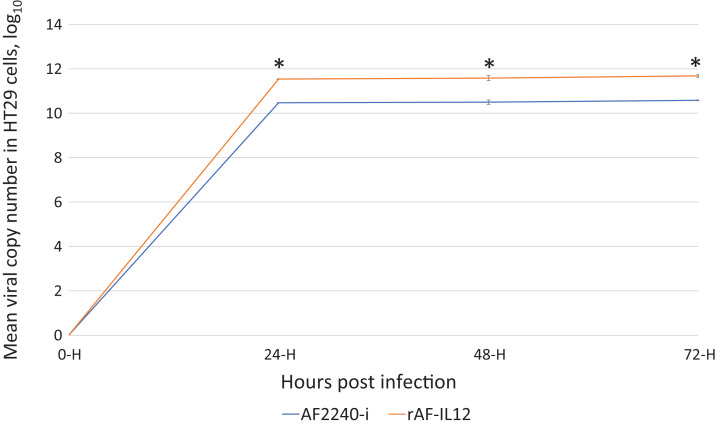
Figure 1. Growth kinetics curve of AF2240-i and rAF-IL12 based on the viral copy number of these viruses detected in HT29 cells at 24, 48 and 72 h post-infection as measured by RT-qPCR analysis.
The copy number was calculated based on the formula generated from the qPCR standard curve of the NDV: X = (y − 58.149)/−3.371; where X is the viral copy number; y is the value mean Cq; 58.149 is the y-intercept value; and −3.371 is the slope of the standard curve. Data are presented as mean ±S.E.M from triplicate determinations. Statistically significant differences between the means were determined by one-way ANOVA followed by Duncan post hoc test. Differences were considered significant when the *p ≤ 0.05.

