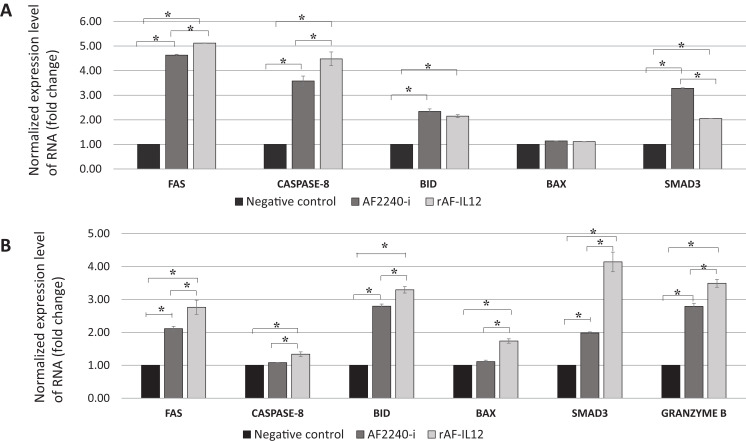
Figure 12. Normalized gene expression level of Fas, caspase-8, BID, BAX and SMAD3.
(A) HT29 cancer cells in vitro and (B) tumour excised from HT29 tumour-burden mice (note the addition of granzyme B expression). Data are presented as mean ±S.E.M from three independent experiments. Statistically significant differences between the means were determined by One-Way ANOVA followed by Duncan post hoc test. Differences were considered significant when the p ≤ 0.05 as indicated by an asterisk (*).

