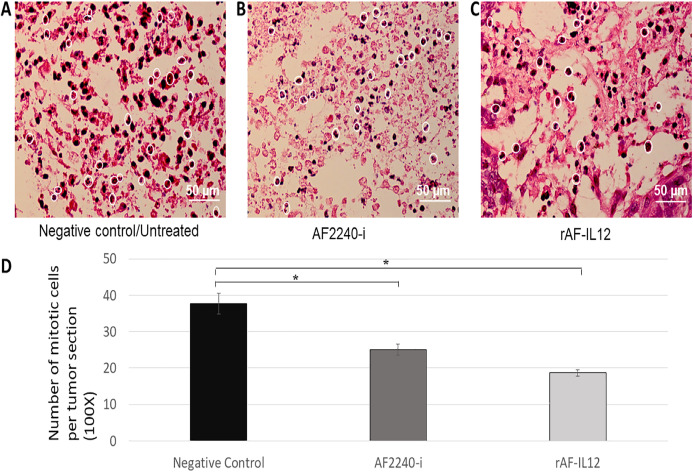
Figure 14. (A–C) Photomicrograph section of the tumour mass of mice stained with H&E from three different groups of mice, negative control/untreated, AF2240-i-treated, and rAF-IL12-treated. The white circles indicate the actively dividing/mitotic tumour cells in the aforementioned groups. Magnification: 400X; H&E scale bar = 50 µm; (D) The number of mitotic cells per tumour section from the negative control, AF2240-i-treated, and rAF-IL12-treated after 28-days of treatment.
Data are presented as mean ±S.E.M. of triplicate determinations. Mean values with statistical difference at p ≤ 0.05 between groups are indicated with an asterisk (*).

