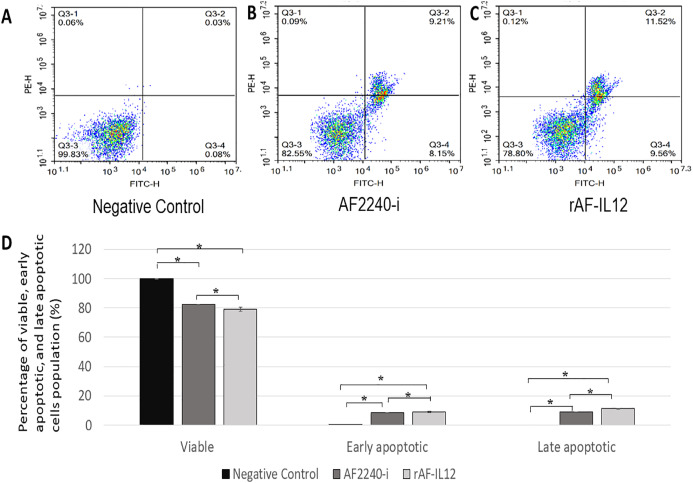
Figure 3. Annexin V/FITC assay in HT29 cells following AF2240-i (128 HA titre) and rAF-IL12 (110 HA titre) 72 h post-infection.
(A–C) Typical quadrant analysis of Annexin V/FITC flow cytometry of HT29 cells apoptosis. The lower left quadrant of each group indicated the viable cells population; the lower right quadrant indicated the early apoptotic cells population; the upper right quadrant indicated the late apoptotic cells population; and the upper left quadrant indicated the necrotic cells population. Two fluorescent dyes were used in this assay which are FITC (x-axis) and PE (y-axis). (D) Percentage of viable, early apoptotic, and late apoptotic cells population analysed by quantitative analysis. Data are presented as mean ±S.E.M from triplicate determinations. Mean values with statistical difference at p < 0.05 between control, AF2240-i and rAF-IL12 are indicated with *.

