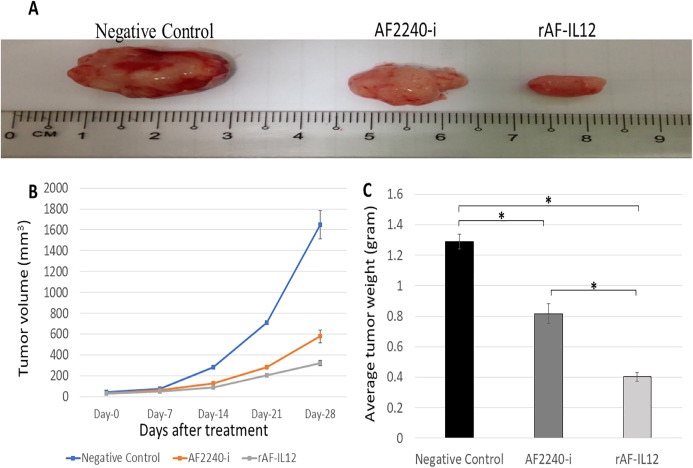
Figure 5. Effects on the HT29 tumours for the negative control, AF2240-i, and rAF-IL12 groups.
(A) Images of HT29 tumour harvested from negative control, AF2240-i, and rAF-IL12 groups following the 28-days of treatment. (B) The growth rate of the HT29 tumours from day-0 until day-28 of treatments. (C) Average weight of HT29 tumours harvested from mice after 28-days of treatment. Data are represented as mean ± S.E.M. Mean values with statistical difference at p < 0.05 between control, AF2240-i and rAF-IL12 are indicated with an asterisk (*).

