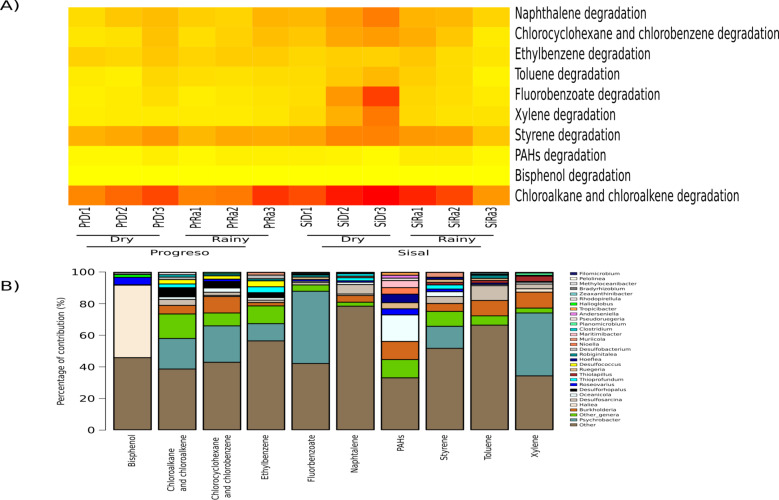
Figure 5. KEGG categories (at level 3) associated with hydrocarbon-degradation found in the sediment microbial communities.
(A) Heat map of 11 categories, each column corresponds to a sediment sample and each row corresponds to a specific category. (B) Top 10 most important contributors to each metabolic function. The taxa associated with the functions are represented by different colors and “Other” represents the OTUs that were not assigned to the genus level.

