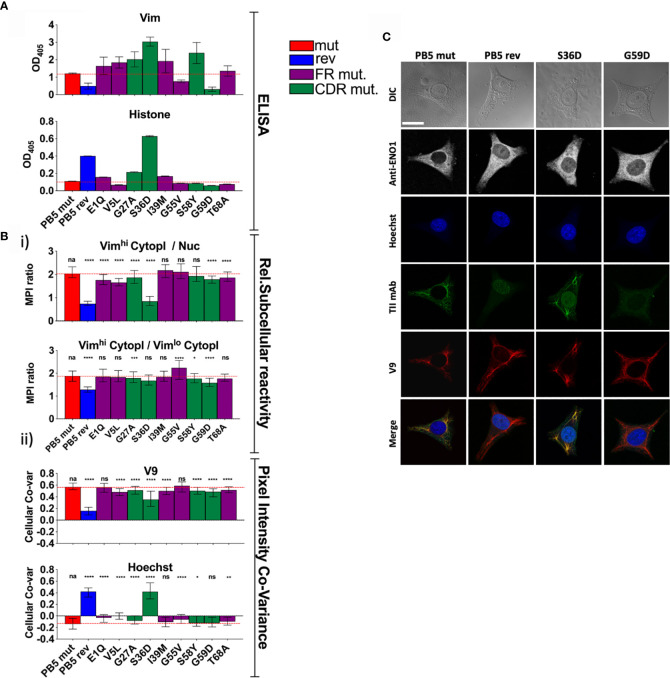
Figure 4.
Individual PB5 heavy chain reversions and antigen binding. To determine the relative influences on antigen binding of individual SHMs, variants of TII mAbs PB5 were made such that individual heavy chain SHMs were altered to their predicted germline amino acids. (A) mAb reactivity by ELISA. Means and standard deviations are shown. Bar colors represent whether the AVA is fully somatically hypermutated (“mut”), completely reverted to predicted germline (“rev”), or (for a single amino acid reversion) whether the reverted amino lies within framework region (FR) or the complementarity-determining region (CDR). Red dashed lines represent the values for mut AVA binding. (B, C) HEp-2 cells were co-stained with V9, Hoechst, anti-ENO1, and one of the indicated PB5 variants. Raw channel data from ten respective FOVs per mAb (approximately 10 cells/FOV) was processed using the CytoSkaler. (Bi) Ratio of MPIs between the indicated subcellular areas medians and interquartile ranges of values for segmented individual cells were plotted. (Bii) Co-variance of pixel intensities between the respective PB5 variant mAb and V9 or Hoechst. Medians and interquartile ranges of values for segmented individual cells were plotted. (C) Single cell examples of the staining patterns yielded by the indicated PB5 variants. White scale bar = 10 microns. Statistical differences (Mann Whitney tests) between the fully mutated AVA and the respective AVA variant are indicated. For panels A and B, q values were calculated, *q < 0.05, **q < 0.001, ***q < 0.001, ****q < 0.0001. Other values are p values (Mann Whitney) with same key.

