Table 2.
Fusogenic potency and pharmacokinetic properties of 1 analogs bearing cyclohexane and triazol group substitutionsα
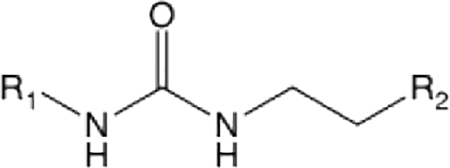 |
|||||||
|---|---|---|---|---|---|---|---|
| Cpd | R1 | R2 | EC50 (nM) | t1/2 HLM (min) | t1/2 MLM (min) | PAMPA-BBB Pe (nm/sec) | Plasma t1/2 (hours) |
| 2 | 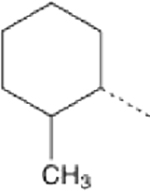 |
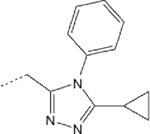 |
4.86 (4.05–5.82) | 6 | 2 | 21.7 | 0.21 |
| 4 | 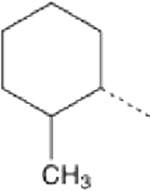 |
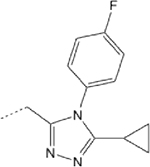 |
76.02 (33.15-ND) | 5 | 1 | 36.6 | ND |
| 5 | 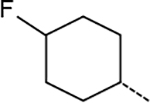 |
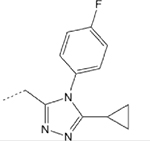 |
5.13 (2.64–9.11) | 62 | 17 | 1.4 | ND |
| 6 | 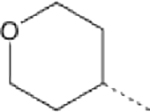 |
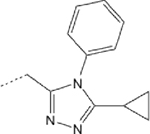 |
10.11 (3.49–28.47) | >145 | 91 | 1 | 0.19 |
| 7 | 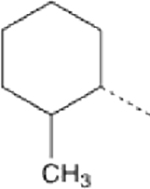 |
 |
>1000 | 43 | 6 | 10.4 | ND |
| 8 | 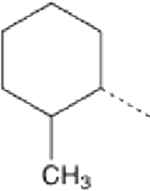 |
 |
5.26 (3.12–8.37) | 8 | 28 | 10.3 | ND |
| 9 | 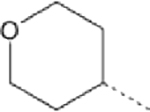 |
 |
2.26 (1.01–4.65) | >145 | >145 | 0.03 | 0.38 |
EC50 values are mean with 95% confidence limits. Plasma t1/2 is in mice after IV bolus administration. ND means not determined.
