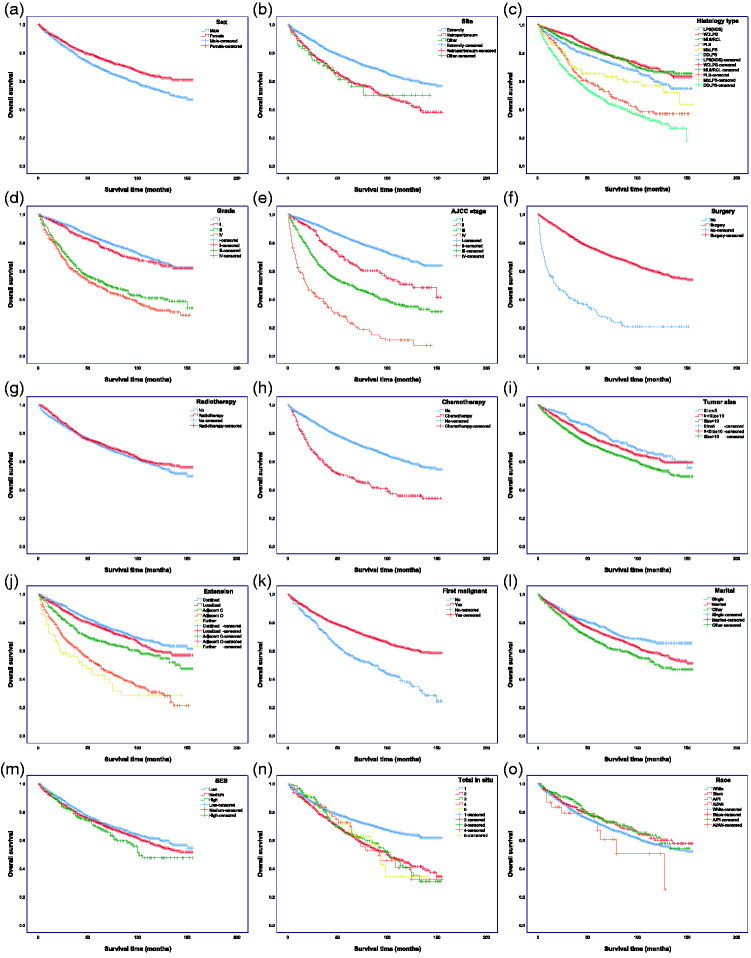
Figure 2.
Kaplan–Meier curves of overall survival in patients with liposarcoma (LPS). (a) Sex, (b) race, (c) site, (d) histology type, (e) grade, (f) AJCC stage, (g) surgery, (h) radiotherapy strategy, (i) chemotherapy strategy, (j) tumor size, (k) extension, (l) first malignant (LPS first malignant tumor), (m) total in situ, (n) marital status, (o) SES. The P values are shown in Supplementary Table 2
SES, socioeconomic status.

