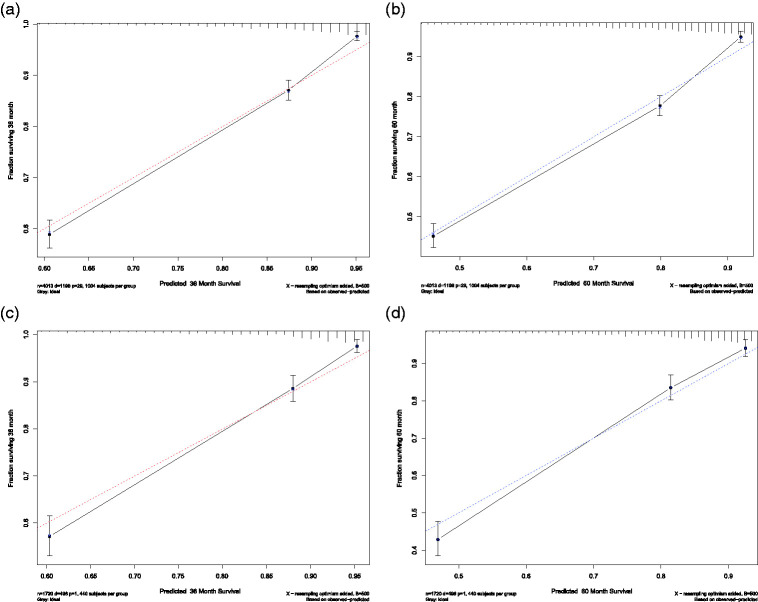
Figure 6.
Calibration plots for predicting 3-year and 5-year overall survival (OS) in the training and validation cohorts. X-axis: bootstrap-predicted survival; y-axis: actual outcome. Calibration plots for (a) 3-year OS in the training cohort, (b) 5-year OS in the training cohort, (c) 3-year OS in the validation cohort, and (d) 5-year OS in the validation cohort.

