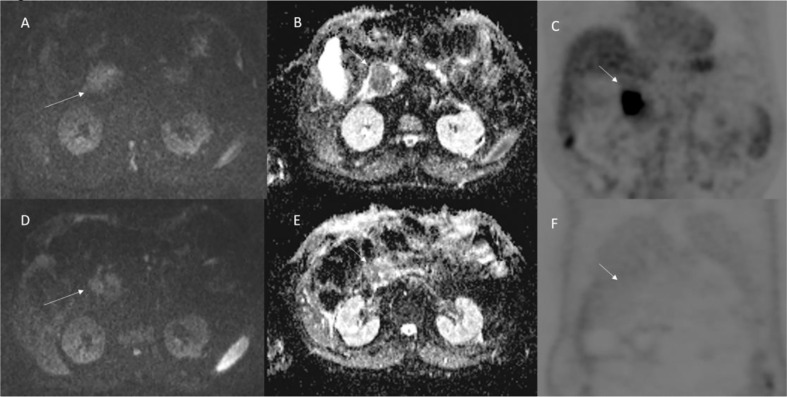
Figure 5.
Patient 3 with head pancreatic cancer (the same of Figure 4 ). Functional (DW-MRI and PET) assessment post-ECT treatment. In (A) (pre treatment) and (D) (post treatment) (b 800 s/mm2) the lesion (arrow) shows restricted signal so as in ADC map (B: pre treatment; and E: post treatment) the lesion shows hypointense signal (arrow). This qualitative analysis is indicative of non-responder lesion. The PET (C: pre treatment; and F: post treatment) assessment shows (arrow) a responder lesion.

