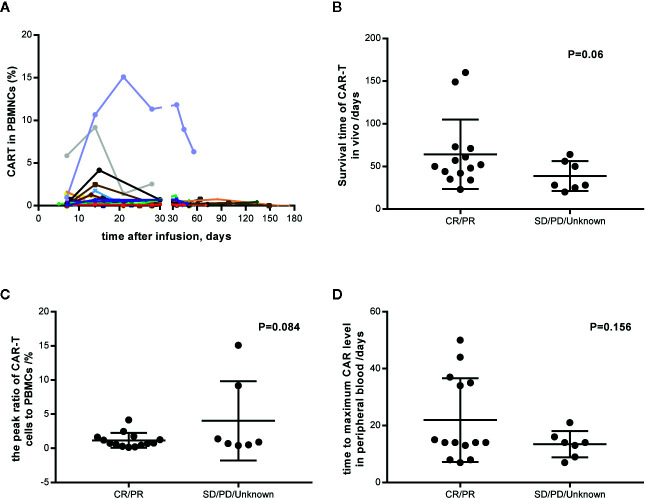
Figure 6.
CAR-T cell expansion in vivo and its relation with response. (A) Individual concentration-time profile in all patients. (B) Survival time of CAR-T cells in vivo in responders and nonresponders. (C) The peak ratio of CAR-T cells to PBMCs in vivo in responders and nonresponders. (D) The time to maximum CAR level in peripheral blood. PBMCs, peripheral blood mononuclear cells. CR, complete response; PR, partial response; SD, stable disease; PD, progressive disease.

